HI All
I have been facing some issues in charting.
in different time frames chart show different levels.
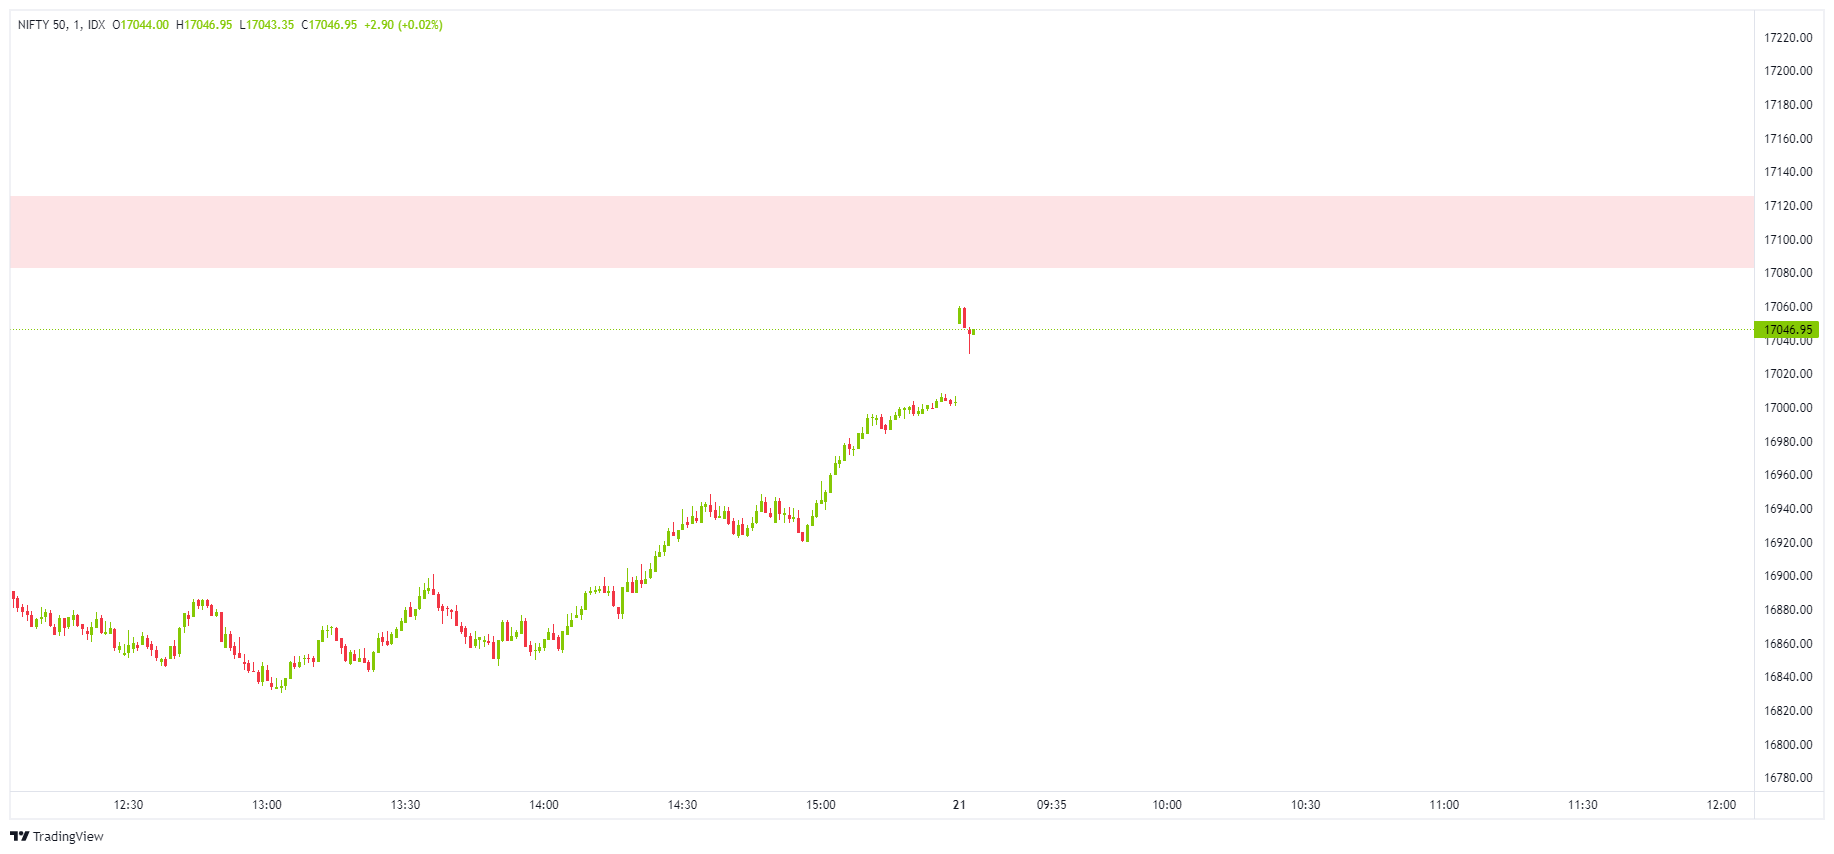
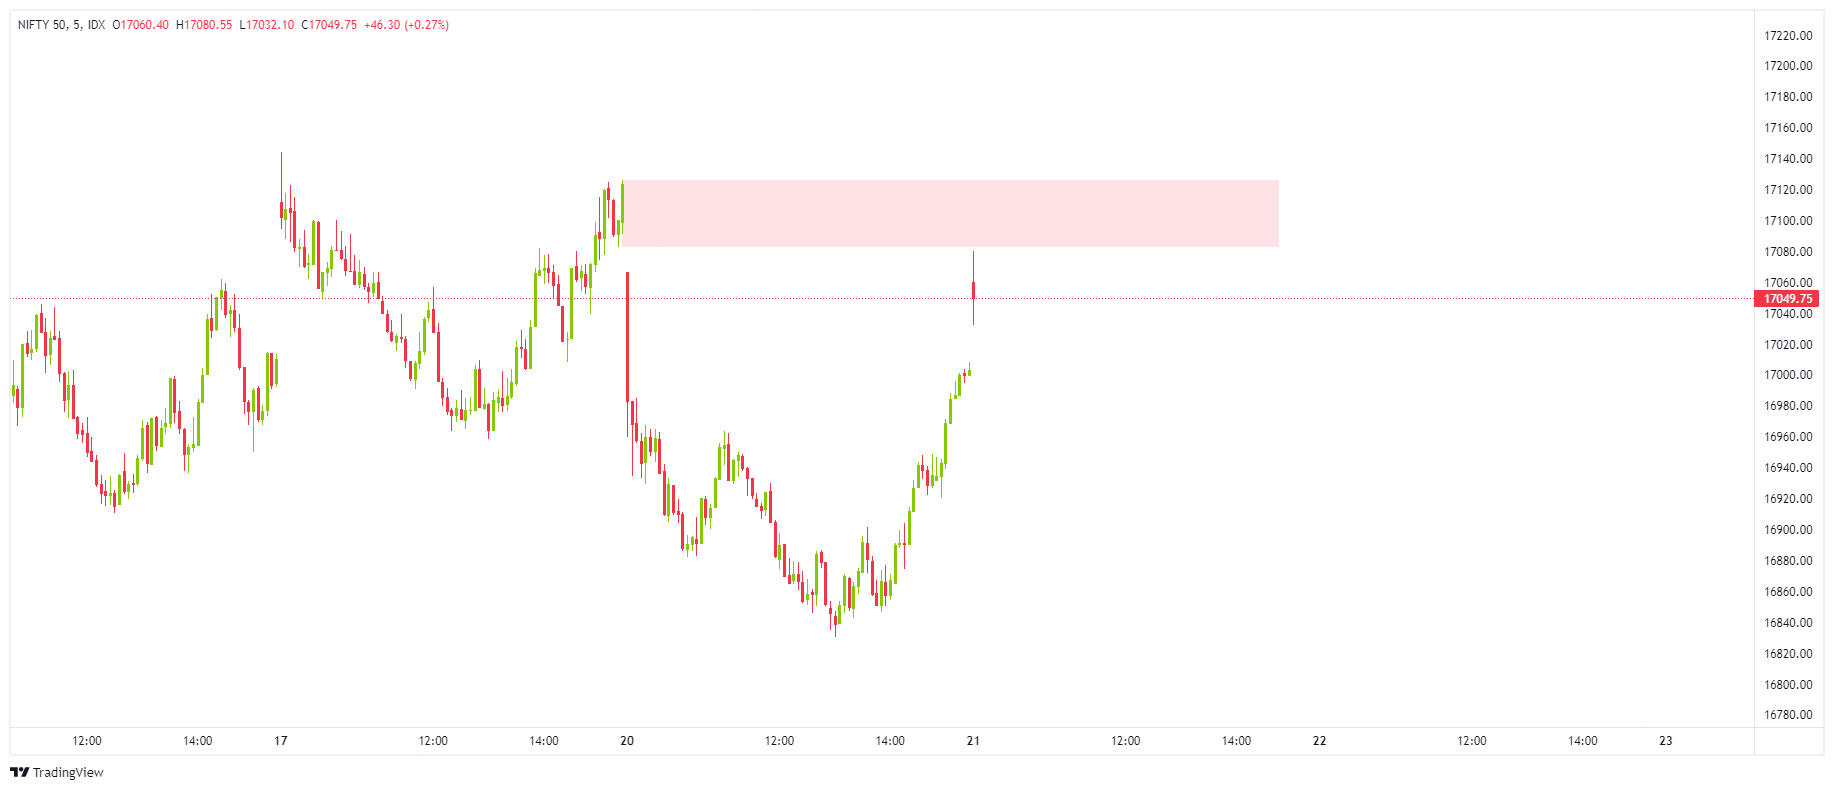
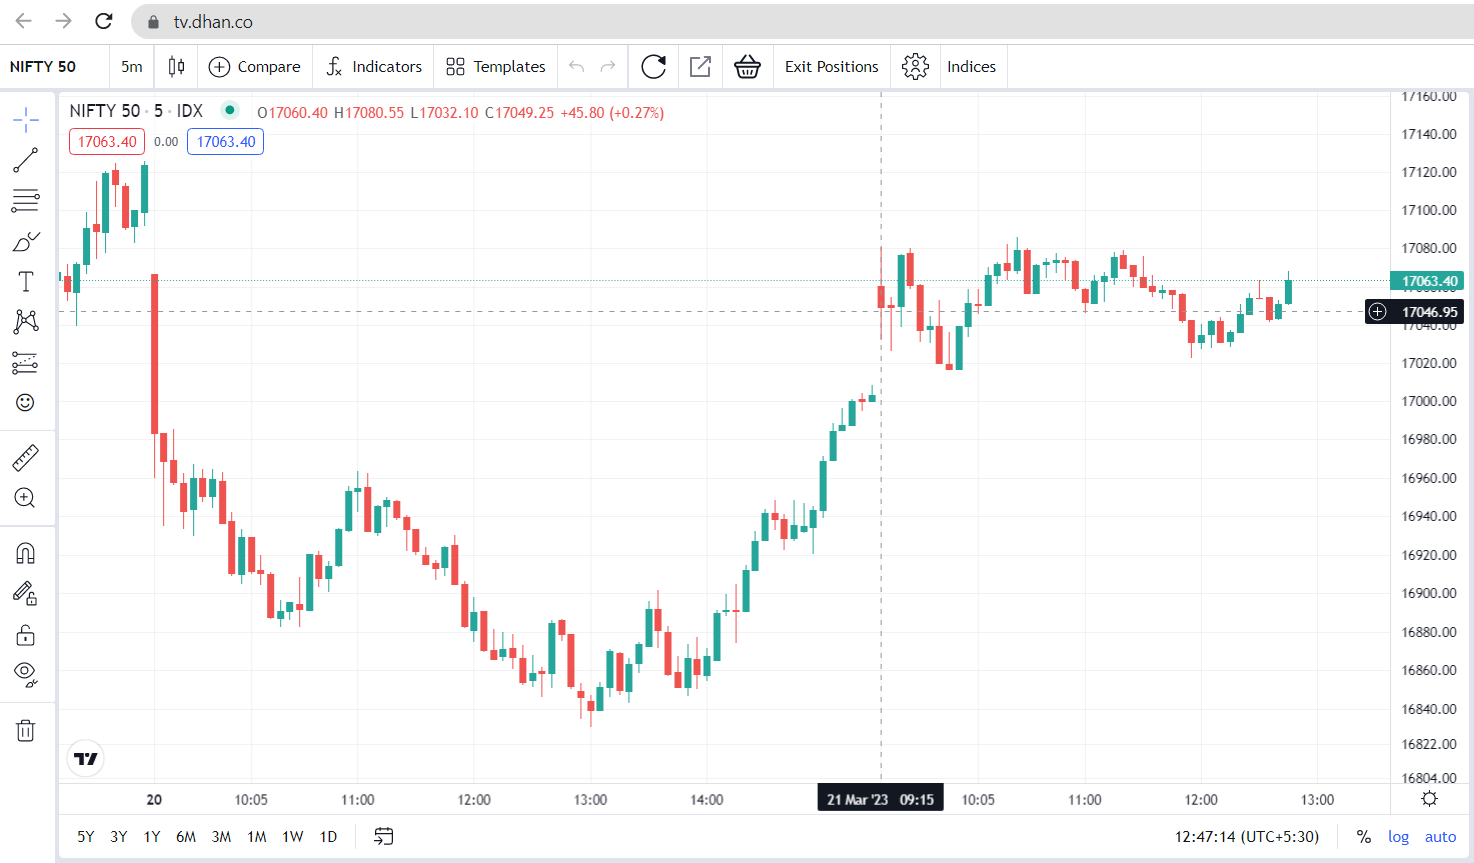
Today in Nifty when market opened first 5 minute candle show high as 17081 and in 1 minute chat first it shows 17060 its 20 points difference.
I am attaching images of 1 minute chart and 5 minute chart
Hi @Pankajchaugule,
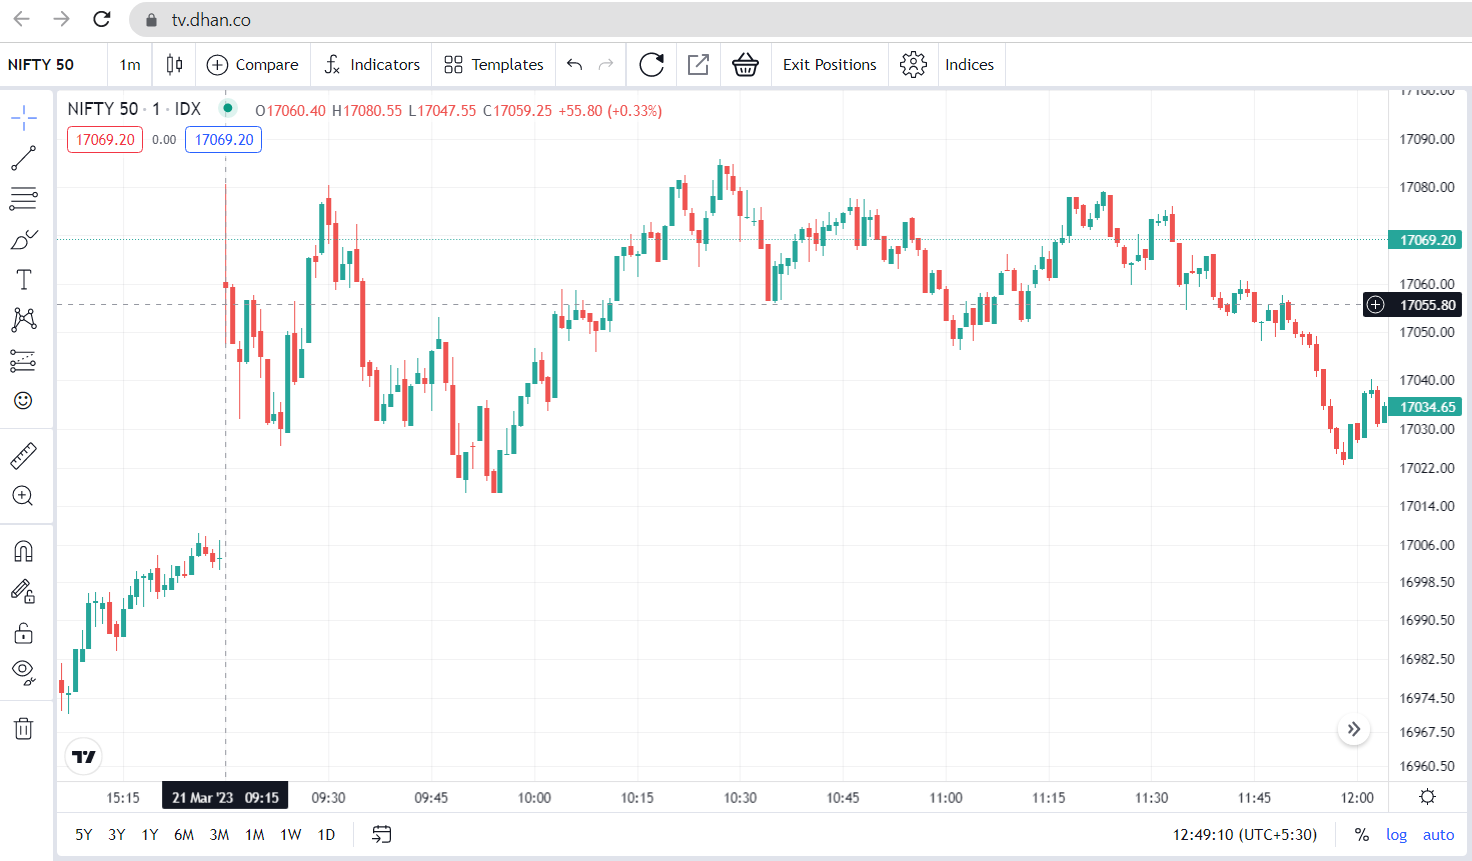
We tried replicating the same and found high price is shown same on both the time frames (screenshot attached).
Kindly hard refresh once and check.
Hi Poornima
Thank you so much for your reply. You are right after sometime it shows correct levels same. But in realtime it shows different. It takes a while , more than 4 5 mins.
@Poornima
dhan web chart is based on what, I mean bid or LTP. because I see the chart’s last price doesn’t match any of the data .please look into this.