Charts on Dhan: What happens behind the scenes and how Charts work exactly?

Charts on Dhan: What happens behind the scenes and how Charts work exactly?

Hello Traders,

We know that Charts are one of the most valuable tools in any Super Trader’s tool-kit.

By now most of you know that we build Dhan based on continuous feedback & suggestions from our users, and our users reach out to us through lots of channels. Additionally with Dhan, we just don’t launch features - we also build upon them and continue to enhance them with time. We believe in addressing every query and also evaluate all the suggestions we get.

We provide you incredible charting experience on Dhan in a special partnership with TradingView where more deeper integrations and trader friendly tools and capabilities are introduced, and few of them are industry first including one of our favourite is ability to execute orders (single or basket of orders) directly from TradingView using free Webhooks that Dhan provides. As always, Dhan gets better everyday and there is more to come.

While we continue to receive appreciation, suggestions and feedback from our users, we have also received concerns on price differences in live charts, slowness or lag on Dhan charting platforms and in many cases where users have compared price / data on Dhan with other platforms or charting tools.

As these charting libraries are a core part of our product experience and traders actively use this, we thought it would be best for us to explain to our users what goes behind the scenes and how charting platforms work and render data when they are at work.

For starters note that:

  • The market data for building these charts comes directly from live feeds of stock exchanges via our servers that are connected by dedicated leased lines to exchanges.
  • We are directly connected to all three exchanges - NSE, BSE and MCX.
  • We do not source live feeds data from any third party or data provider, it is sourced directly from stock exchanges.
  • At Dhan, we keep > 60% bandwidth free at all times to ensure your orders are instantly sent to exchanges.
  • We serve data feeds independently to all our platforms - which means we have dedicated and multiple servers to serve live exchange data for all trading platforms be it Web, Mobile or TradingView.

With that, let me come to some of the explanations on how charts work and questions that get asked to us frequently from traders who use charts.

Why is there a difference in charts between two charting platforms?

To explain this, let’s start with how charts are created in live markets. There are two scenarios here

  • When you open charts in non-trading hours, charts data come from servers where it is stored
  • When you open charts in trading hours, past data again comes from servers, and the live data of the selected time-frame comes from live market price ticks from exchanges.

Yes, so the live data for the ‘currently selected time-frame’ is first rendered on your charts and then it is saved in the background the moment the time-frame ends as OHLC (Open High Low Close) for that timeframe. This means that there is a good chance of some price ticks getting missed by your device due multiple reasons - the moment you land on the chart, the connection at time of request made and also as a result of internet drop or packet loss (which is quite common in India) - and this may happen despite the fact that you are connected via 4G, 5G, broadband or a leased line.

As a result of this, there will be a slight difference in the chart displayed. However, when you look at past candles, there is no margin of data being lost as our chart data servers are present within the same data centre as our streaming servers and the data is continuously saved on server side.

To take an example, when markets go live at 09.15, if you open a chart with 1 min time frame, the candles getting formed are based on live data received on your device over the internet. Once the candle starts forming, it is possible that you might lose a couple of ticks in between due to intermittent internet connection which may create a slight difference in the formed chart.

Now, if you are on the chart for 10 minutes i.e. till 09.25 and then refresh the chart, you may observe the previous 10 candles being changed slightly. This is because when you refresh or reload, this time the chart fetches the data from our chart data server which does not have any missing price ticks.

One underlying phenomenon here is that you might have opened the chart at 9:15:20 in the beginning which implies 20 seconds after the minute started. Since, the data comes from the historical data server only after a minute is completed, the chart thus formed might lose some ticks from the beginning as well.

Again, these are rare scenarios where you will find noticeable differences in charts between two charting platforms. However, it is our priority to keep our users informed, always.

How did my order get executed at a price which the chart never reflected?

Market data for every stock / instrument comes directly from the stock exchange. Exchange processes millions of transactions each day which translates to a lot of transactions per second.

Now, each transaction represents a tick. However, it is not feasible even for exchanges to send all of this data via ticks as every tick is a representation of all transactions that happened in that ‘moment of tick’. So as an industry standard, a snapshot of a tick is sent by the exchanges to the data feeds or market tick by tick data, which results in the end user seeing the price of the stock / instrument as an LTP.

This tick is shown on your device which is live market price and the same data is used to plot charts. Now, this per second tick is one of the many hundred ticks that take place on the exchange every second. So, it is quite possible that sometimes your order gets executed at a certain price without that price getting reflected on your screen.

We have also come across instances where the OHLC has adequate information, but the same was not even reflected on the exchange’s own stock graphs / charts.

Is it possible that a chart in the same time-frame will be different across different brokers?

Yes, it is absolutely possible for that to happen and in it happens as well.

Beyond the two reasons that we have explained above there are many things that happen on the backend behind the scenes - which means where are our servers located, where are the stock exchanges servers located and to which of those servers of stock exchange we were connected at that moment and more. Also to be noted that this is just connectivity between exchange and the broker, and similar to this is the connectivity that you have with Dhan as a broker.

All of the above results in multiple permutations and combinations, and as result - yes it is possible to have different charts for the same stock or scrip in the same time-frame.

But I am on a high-speed broadband connection, why are my charts stopping in between? This shouldn’t happen.

Yes this can happen. Please note that the marketed speed of your broadband connection and the speed of actual data transfer are two different things. For example - my current connection as per Fast (dot) com is 140 Mbps but my data transfer as per speed tracking tools like Meter (dot) net are significantly slower. Additionally your data transfer speed is not always constant, it depends on factors like your data consumption on other devices in home, your applications and other usage as well.

From the perspective of charts - when charts are loaded on your browser we connect via your internet connection through websockets where there is an assumption of continuous data connectivity and transfer is available. When data transfer rates drop below required rates, there is an empty tick that is received for that second and it continues. In such a scenario, our charts keep trying re-connecting back to our servers in the background and then charts will be rendered when data transfer is reestablished either automatically or via a refresh.

We also notice many of our users are using our multi-charts facility that’s provided on TradingView console of Dhan on tv.dhan.co, here it has to be noted that when you open a window with 8 charts at once, your that browser tab for chart is consuming 8 times of usual data on that single websocket - so on a lower speed data transfer, this may become more evident.

For staying best informed of your connectivity at all times, we request you to ensure add data transfer tools in your browser / system taskbar of Windows or Mac machines. If you think your connection is good and you have to refresh - we recommend doing a browser refresh over a chart refresh. A chart refresh, will just refresh data that is loaded on the chart and also its indicators, but a browser refresh will load all the charts again and also reconnects the browser with data through our websockets. And don’t worry much here - on Dhan we save your charts, indicators, patterns and all that matters automatically on server side so that you continue to enjoy seamless trading for charts experience.

Concluding Notes:

At Dhan, we are building for an incredible trading & investing experience with a lot of focus on product, technology and customer service experience. Trading systems are hard and also complex, and so are charts. As a team we want to ensure we get your experience right on Dhan.

As always, Dhan keeps getting better everyday.
pj
7 Likes

i understood one thing that dhan data is far better then other providers that actual work is happening in my pc and browser that everything matters from my pc to my isp to dhan servers to nse server so chances of error is more compared to other broker who form chart at there end and stream that chart to us
i think you are way ahed of indian norms that people are not ready for it
thanks for this explanation clerad lot of things for me

For example - my current connection as per Fast (dot) com is 140 Mbps but my data transfer as per speed tracking tools like Meter (dot) net are significantly slower.

Couldn’t understand this. Don’t think this is technically accurate too as both fast.com and meter.net are speed measuring websites. Their methodology might be different but in essence there is no difference as per my understanding.

Do check some of the answers here, speeds vary for multiple reasons and for multiple ways, lots of questions and many answers: https://www.quora.com/My-internet-download-speed-on-Speedtest-net-is-48Mbps-However-when-I-browse-it-is-very-slow-What-might-be-reason-for-slow-connection

Yes, there are variety of reasons for slow internet. My reply was specifically in relation to the quoted block.

Anyways, I believe the most common reason for this issue (i.e., internet is felt slow while browsing/downloading but on speed measuring sites speed is good) is that speed measuring sites measure speed through multiple threads and to the nearest server in the vicinity. But that is rarely the case in real world.

For e.g., if I’m in Kolkata, speed measuring sites will measure speed from a server in Kolkata whereas while visiting Dhan, I’m fetching data from Dhan’s server located in Mumbai. So, there will always be a lag in comparison to speed test.

1 Like

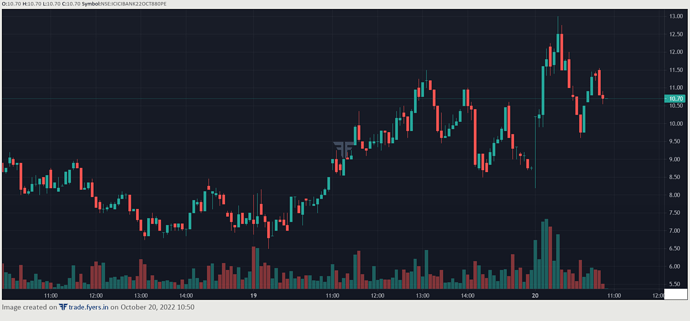
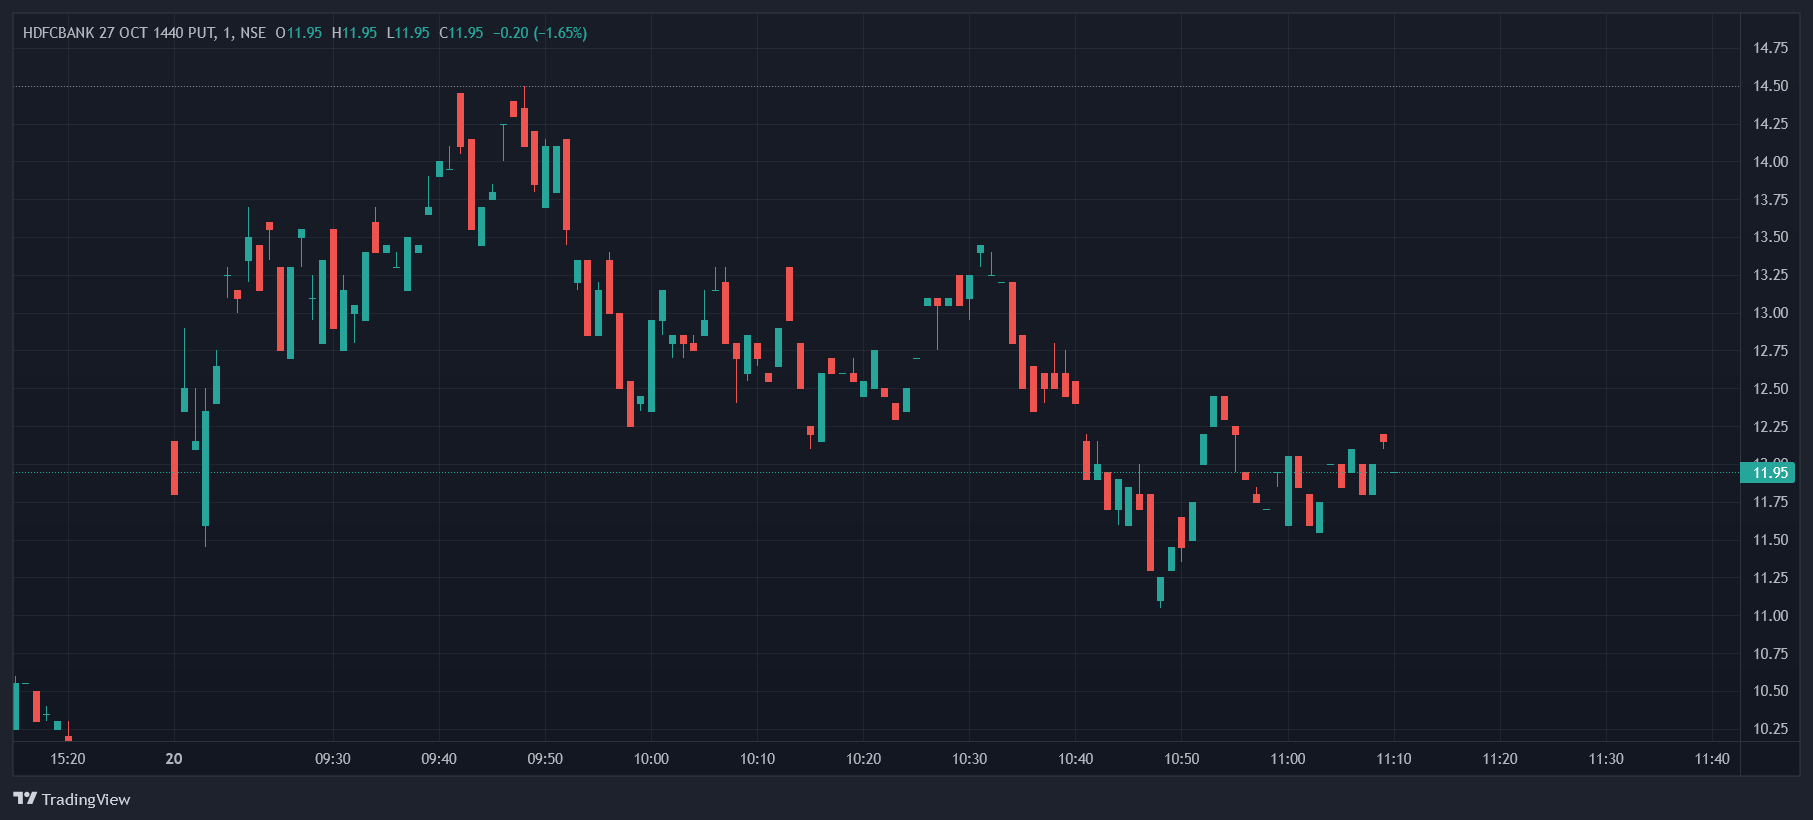
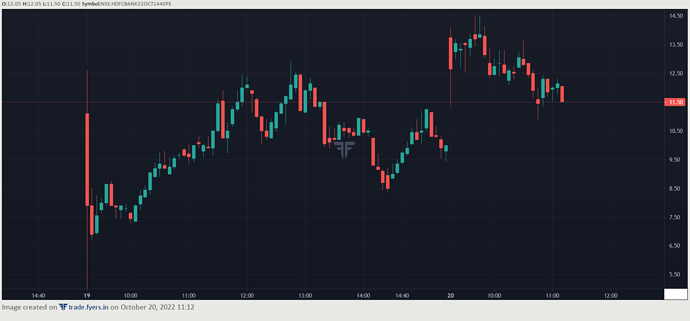
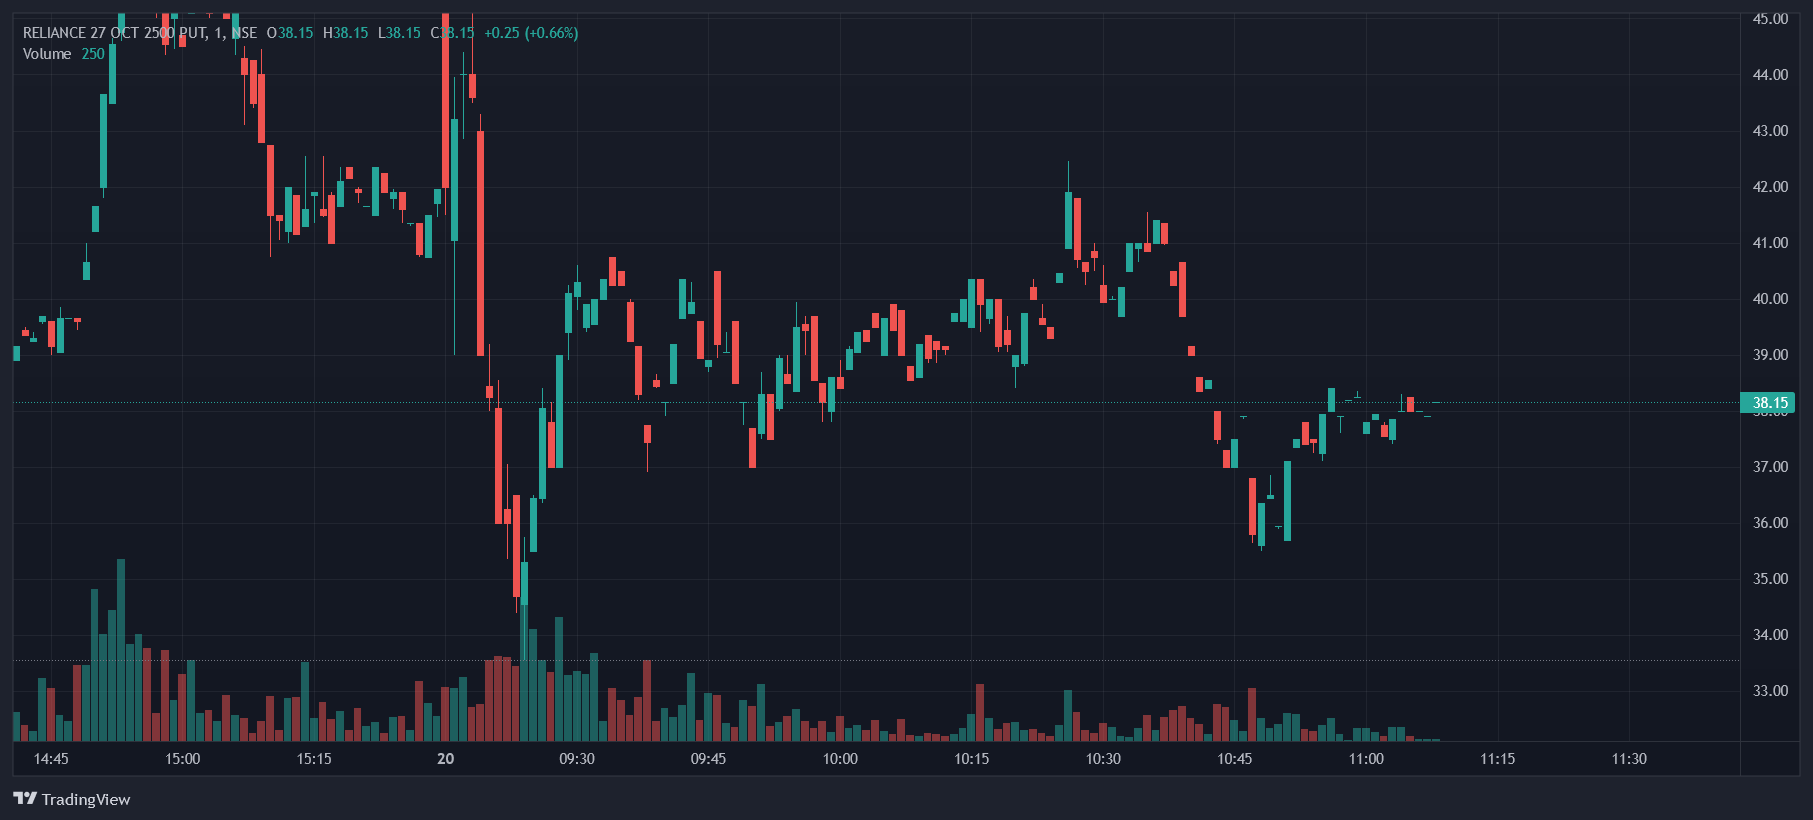
I do have something to share regarding the Charts, I see that most of the Stock option charts in Dhan is way laggy or different from the other sites.
i would like to give an example over here…
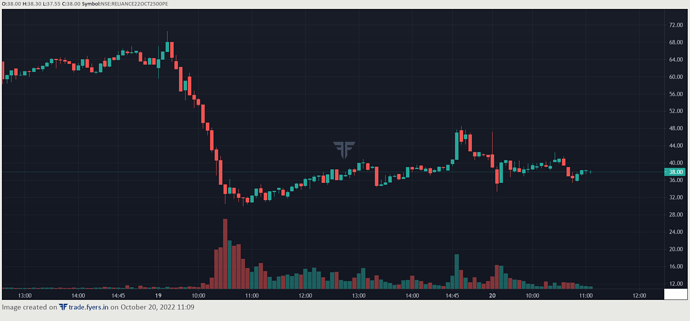
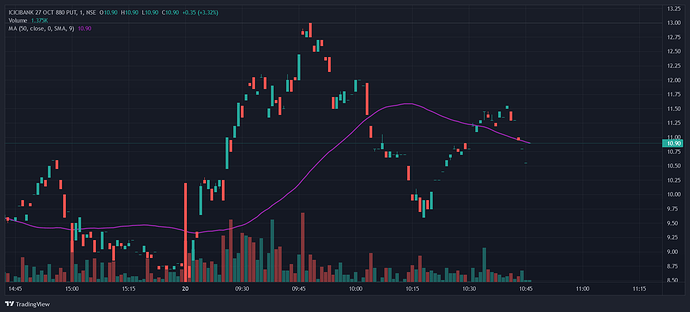
This is ICICI Bank 880 Put chart in Dhan & Fyers Comparision


You can clearly see that the stock option charts in Dhan are not at all liquid, I can see huge amount of empty spaces in the chart which shows that stock option charts in Dhan are not at all Liquid!!

Not only ICICI Bank, you can take any Big Stock & observe its options chart in Dhan, you would see this issue is happening with all the stock option charts in Dhan. Please fix this issue up. @PravinJ @naman @Kiran @Pranita
I am attaching few more stock option charts in both Dhan & Fyers for your reference


2 Likes

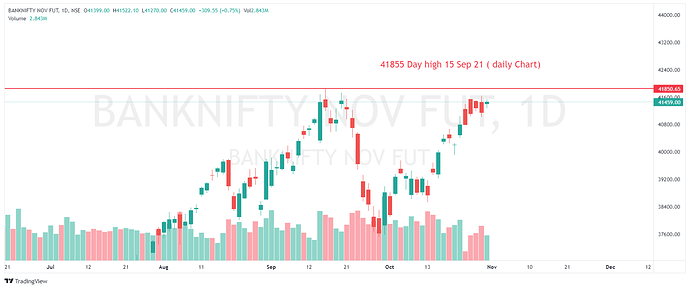
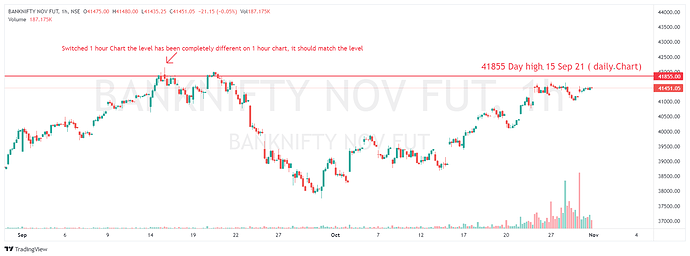
Daily high doesn’t match to the 1 hourly time frame, As your executive concluded that dhan processed data different way compare the other broker, I am unsatisfied such unreliability and inaccuracy of charts

Hi @kckittu

Apologies for delayed reply. Not sure how we missed post.

Coming on the point of empty spaces and low-liquidity on charts -
As explained in the first post of this thread, the data on dhan’s chart is exactly same what we receive from the exchange.
You have compared the Dhan 1min chart with other platform’s higher timeframe chart. This will, as obvious, will show gaps on chart and low liquidity (which is true).

Hope this solves your query!

1 Like

Hi @OptionTrader

The charts on Dhan are continuous charts in daily timeframe and non-continuous in intraday time frame, that means you will be able to see all the first month (current/near month) data set on the Nov month futures chart.
Like, in the month of Nov you will Nov month data on chart from Nov1, from Oct1 you will see Oct month chart and so on… in daily time frame. But for intraday timeframe, you will only find Nov month data set throughout the chart.

Hope this helps!

So isnt there any way to fix ?

May your logic and perspective are different but result must be accurate, I dont see the reason to stay because inaccuracy

Hey @OptionTrader

It seems one of the pic is set for daily timeframe and other for a 30 min time frame. Hence the difference. You will find similar difference between intraday timeframe and daily timeframe on other charting interfaces like in.tradingview.com. This is because intraday time frame candles are built using the ticks received intraday from the exchange which could have missing ticks. Daily candles are built using the bhavcopy released by exchange at EOD which has the OHLC considering all ticks for the day.

I think Dhan is building a great product and backing it with great customer support. I wouldn’t jump ship because there is no other such ship to jump into currently. I know certain elements are missing but that is expected to come soon.

5 Likes

A general question: Why do brokers always rely on 3rd parties for charting? 3rd party charting platform creates dependence for even the smallest of update. Why does no one create their own in house charting solution from scratch? This gives full control and can add absolutely any feature under the sun.

Brokers, if you really ask - they have to just provide execution capabilities on exchanges. Everything else a broking platform is enablers, including charts, data, insights, etc etc.

Not just charts, you will be surprised how much of tech, even for large brokers who claim to do tech is either outsourced or vendor managed. Coming specifically to charts - one can, in realistic terms be good at only with something. Charts are tough, it’s not easy and, at least from perspective of Dhan - we prefer to make trading products & platforms and use the best of ones available - which is TradingView and ChartIQ.

Also, lets say hypothetically we start building charts - TradingView is a team of 500+ and started 10+ years back -its going to take that much, and that long to be as good as they are today.

5 Likes

I am disappointed with the conceding tone of the previous reply to be honest, we see Dhan at a better place today than what TradingView or anybody else 10yrs ago.

That being said, the focus has to be back on the chart data quality – not the chart rendering softwares – chart rendering is also a solved problem, thanks to tradingview/gocharting/chartiq etc.

I highly would recommend to have your streaming data leads to take a look at their ingest aggregators and triggers – there is something highly unusual – even sharekhan which is older than most of today’s discount brokerage firms has the best data quality. (Granted they might not have all the bells and whistles but they do have sophisticated execution performance).

1 Like

Apologies for the tone of that, just that I prefer stating things as they usually are. Broking platforms are incredibly complex and have many components.

Execution systems are different from Charting systems. Execution systems connect to exchanges for transactions, and charting systems connect with exchange broadcast. At least that’s how we have designed systems.

Our focus is a lot on building core trading and transaction features, components that help us ensure we provide seamless services even while we scale. We care a lot about reliability in everything we do - just this morning we had few users stating chart load times were high - we immediately were able to deploy additional machines to ensure we cater them well… mentioning this as topic is of charts. Can we build more products, yes - but there is already a lot on our plate. We have mentioned it here: 2023: What next to expect from Dhan

I sincerely appreciate your candor @PravinJ . One of the reasons why a community at Dhan is a good place because of that.

Any trader as an individual is highly dependent on what brokerage provides to them, will have to take what brokerage provides. Nothing unusual about it as long as what brokerage provides is transparent and is full of integrity.

However, it is also important to understand the problem at course here. We are not talking about the new features or new asks and for that matter – it is simply about what is already being provided but is not being met at good operational standards.

just this morning we had few users stating chart load times were high - we immediately were able to deploy additional machines to ensure we cater them well… mentioning this as topic is of charts.

This is a problem, sure, but given the experience already gained in terms of running the infrastructure for over a year, this should be bare minimum about increasing the machines on demand before the problem is surfaced and brought out by the clients. Infact, I would just go about it as a business need to just cater to the growth demand (more new clients, more connections. Data slowness problem seems to be addressed by having just enough compute capacity at disposal and for ready to absorb the demand.

What is missing here – if you ask me, honestly it is – Operational Excellence –
data slowness is a compute problem but data precision problem is not. Data precision quality is what is the concern here.
Many trading decisions are just made on what is seen (it is okay to see the data late by couple of seconds but not okay to see a wrong data). Please take a look at Unreliable charting data for Index options? about the repetition of this.

Looked at the post you mentioned, and @Naman has already answered this. Data Precision isn’t the case in here, the exchange systems are built in a way that the broadcast is snapshot of trades sent by the exchanges, it is not absolute data or entire data. More details explained in the post, quoted below.

Ok thanks for explaining that. One question. Are the ticks indexed, serialized in order?
How is it possible that data vendors like truedata, charting solution like tradingview, trading platform like sharekhan are in sync, almost all the time (well, I have not seen any so far)?

Its a snap - not a serialised one. Even when you compare on any platform that are charting focussed - it will be in sync with most platforms possibly 99 out of 100 times. Other factors that decide are - server locations, exchange pop, connectivity and more.

Charts have two components - one real time that is plotted, and other saved from past data. Past data is from servers - which usually will match > 99.5% of times, and live data that is plotted will be possibly matching 98-99 out of 100 times.