@PravinJ
why is there a different price for the same symbol? I used the candle and heikin ashi chart.
screen recording
https://www.screencast.com/t/iyVKY2tcReN
1 Like
It is totally Normal
The Heikin-Ashi technique uses a modified formula in order to calculate the candles OHLC:
- xClose = (Open+High+Low+Close)/4 - The average price of the current bar.
- xOpen = [xOpen(Previous Bar) + xClose(Previous Bar)]/2 -Midpoint of the previous bar.
- xHigh = Max(High, xOpen, xClose) - Highest value in the set.
- xLow = Min(Low, xOpen, xClose) - Lowest value in the set.
As a result, the last price you see on a regular candlestick chart is different from the Heikin Ashi chart.
well, I think the last price has nothing to do with HA candles, It doesn’t get modified by any formula in HA candles.
The actual TRADED LTP doesn’t get modified but what is displayed does get Modified. All because of the formula I mentioned above.
You should enable “BID/ASK” Lines to see the trading LTP.
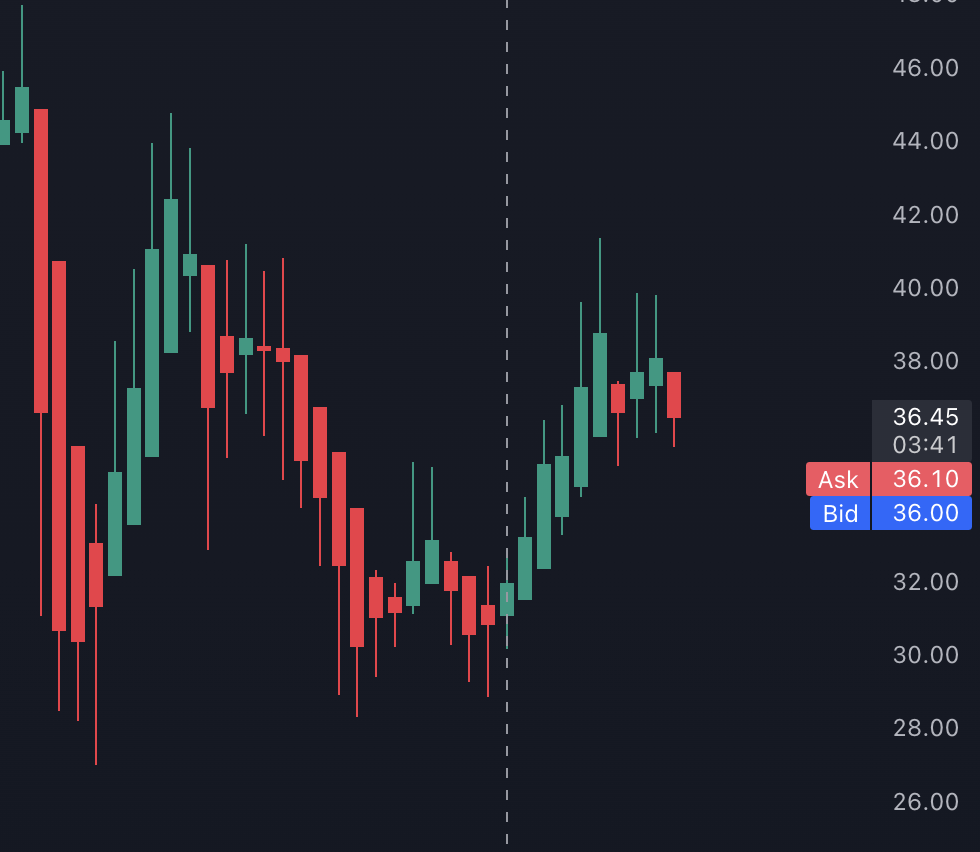
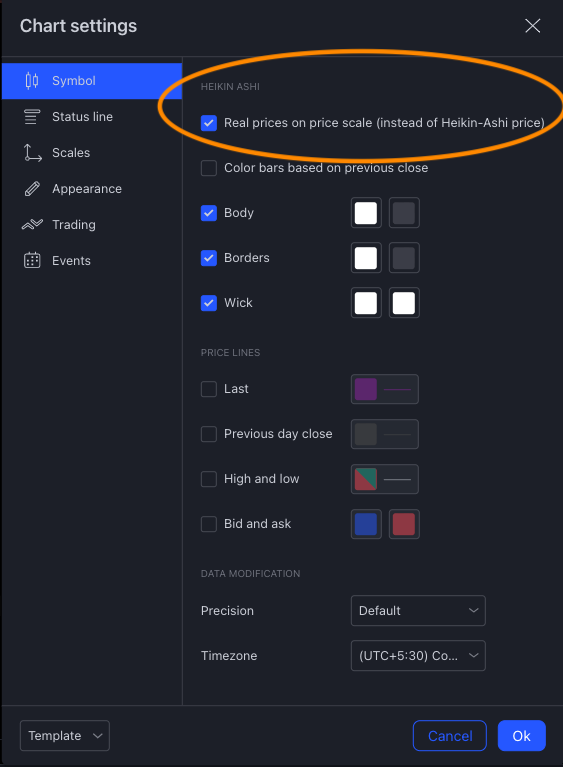
On HA charts, you need to enable following Chart Settings to see the latest LTP.
It seems this option is missing in Dhan TV charts.
1 Like
Nice Spot @amit ! This is a great setting! This correctly solves the purpose to see real price.
Yea, couldn’t find this setting on Dhan TV so asked @HIR to use BID/ASK line as an alternative ![]()

Recently, replicated your concern whenever you move your cursor to a different candle, you need to refresh the chart to show the correct RSI (Relative Strength Index) value.
Every time my buy and sell Order jumping other price
Sir .
Please check my account and find bug .
Order jump
Hi @saddam08888
Welcome to the Dhan community.
We request you to kindly help us with more details at help@dhan.co, so we can check and assist in a better way.