Maximize Your Trading Potential with Boom Hunter Pro - An Oscillator for the Ages.
A few days back I came across this indicator and it made me curious. I learned more and thought to share it with you’ll so here it is.
Want to monitor the best entry and exit points in the stock market? Momentum oscillators are an excellent tool for doing so.
Due to its precise stock market monitoring, which indicates potential entry and exit locations, the Boom Hunter Pro indicator has drawn significant interest.
What is Boom Hunter Pro?
With the Boom hunter pro indicator, traders can easily monitor the market, including long and short entries. The Boom hunter pro indicator monitors the market using the Early Onset Trend (EOT) developed by John Ehler.
The Boom Hunter Pro uses the Center of Gravity Oscillator (COG) and some smoothing and roofing filter options to give customized indications.
The indicator shows oscillations for the desired entries and uses different tools to signal a variety of market trends. Below are some tools used by the Boom Hunter Pro indicator.
Understanding the Boom Hunter Pro Indicator
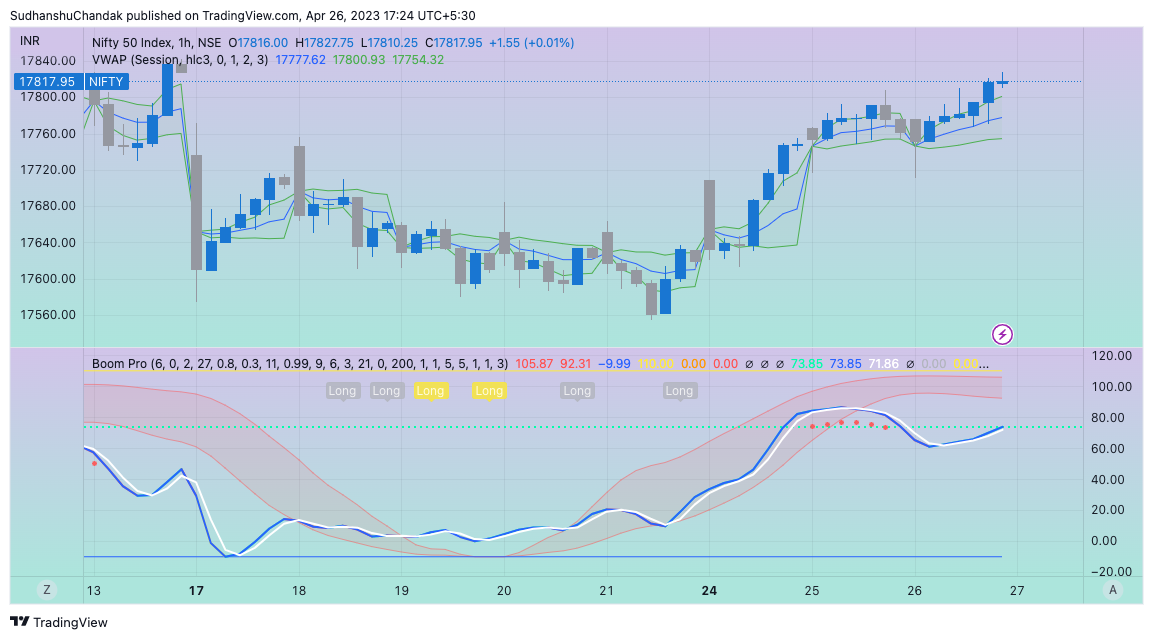
- Colored Bars: The colored bars in the indicator can be specifically used to help you find a particular entry. The lime color indicates a crossover, and orange and red lines show when a stock is overbought.
- Fibonacci Lines: The Fibonacci lines of the indicators keep track of the price fluctuations for particularly long or short entries or exits.
- Time Frames: The Boom Hunter Pro indicator is initially set for one-hour monitoring of entries, although you can use it in any time frame at your convenience.
- Relative Strength Index: The Boom Hunter Pro indicator uses the RSI analysis technique to measure the momentum of the price movement. This helps to give accurate information about the price fluctuation of a particular asset. The RSI usually fluctuates between a range of 30 to 70. When above 70, it is considered overbought, whereas below 30 is considered to be oversold.
How To Use Boom Hunter Pro Indicator
To use the boom Hunter Pro indicator, you will need to install it on your TradingView. Here are the steps to use this awesome indicator for your benefit.
- Visit the official Boom Hunter website and download the boom hunter pro indicator code on your local system.
- Next, open your TradingView charts for the stock you want to monitor.
- Once the code is installed, open the search bar on your trading view chart and search for “Boom Hunter Pro.”
- The indicator will start appearing on your TradingView chart at the bottom.
- Select the desired time frame in which you want to trade. You can choose the 15 min time frame which is the best-suited one.
- Now monitor your stocks with the red, orange, and lime-colored signals shown by the indicator; that’s it.
- Make decisions based on the indications shown by Boom Hunter Pro and trade stocks to make high-profit returns.
The Boom Hunter Pro indicator’s finest entry and exit locations for your preferred trades are now available in this simple manner.
Conclusion
The Boom Hunter Pro Indicator is a long and short-entry monitoring oscillator used by traders worldwide. Since it uses the entire concept of the Center of Gravity (COG) oscillator, traders can easily understand and use it.
However, the indications shown by the Boom Hunter Pro Indicator may only stand out to be true sometimes. Along with this, the forecasting accuracy of the indicator is not 100%. It only gives the possible entry or exit points.
I hope you found this information about the Boom Hunter Pro Indicator useful.
Happy Trading!