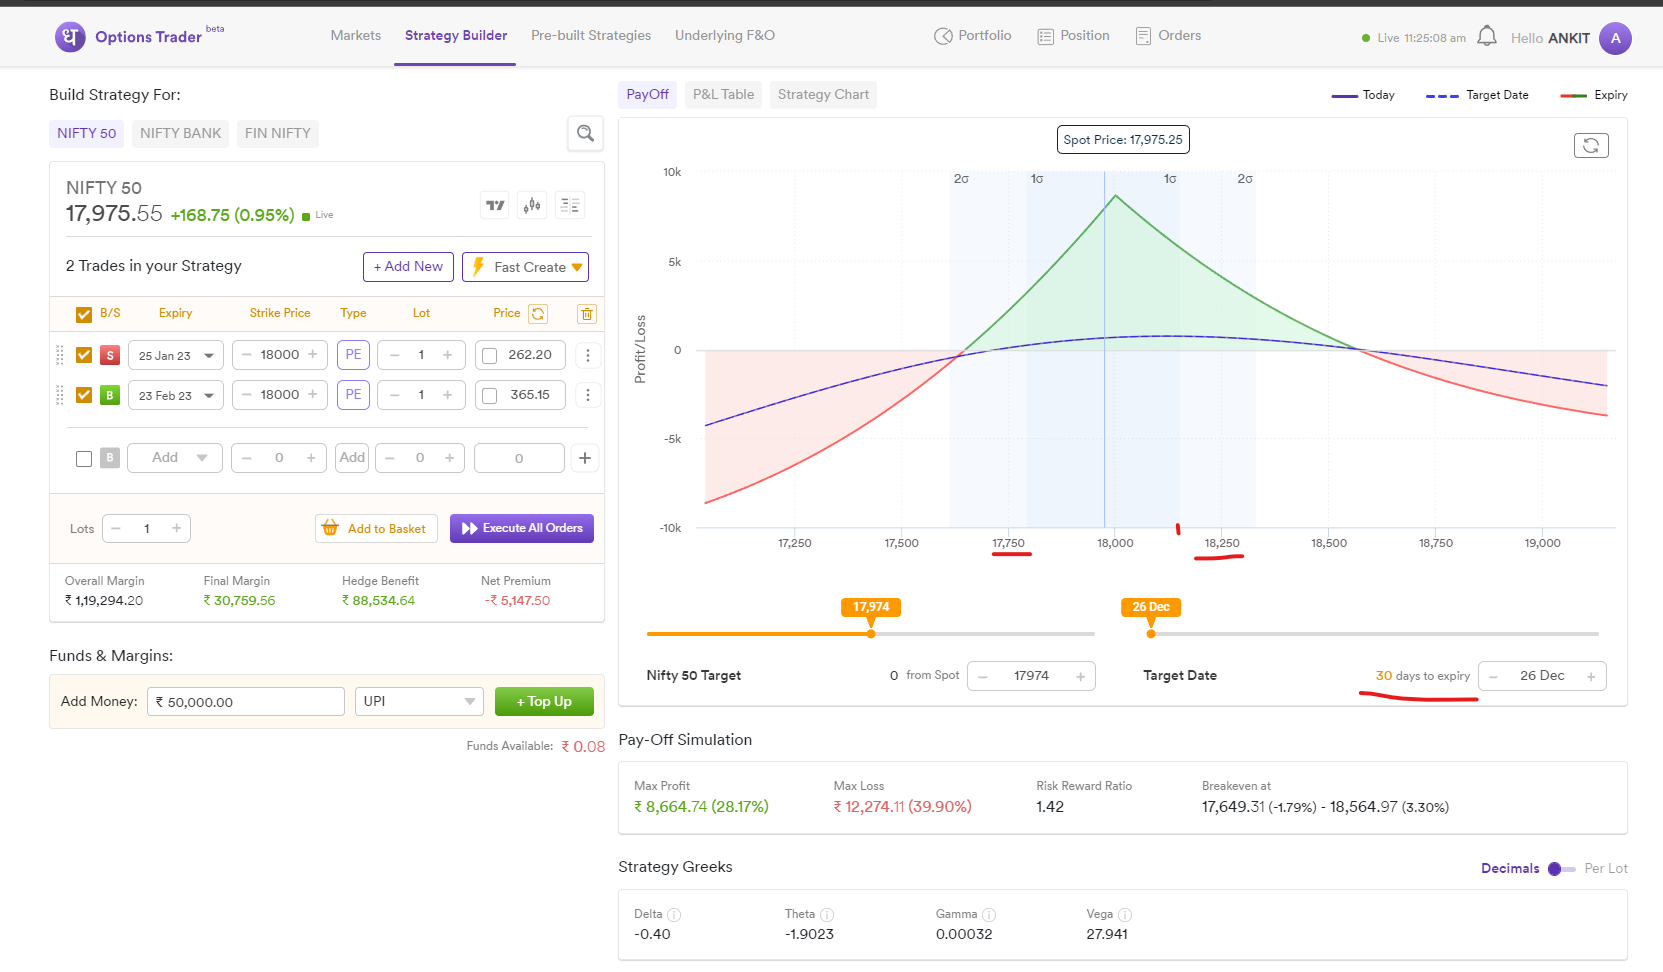
Just by looking at Breakevens which is ~1000 pts, it is clear that for 30 days to expiry 1000 point should be within 1SD range but here it is even going beyond 2SD, then I did some calculations and here is what the range should look like:
ATM IV: 15.5
Days to expiry (DTE): 30
Spot: 17992
SD = Spot X IV X Sqrt(DTE/365) = ~800
1SD Lower side = Spot - 1 X SD = 17192
1SD Upper side = Spot + 1 X SD = 18792
Total range for 1SD = 1600 points
Thanks @PravinJ for quick response. Nonetheless 30 days to expiry is already shown on the options trader and the same should be reflected in the graph too, hope this gets fixed quickly
Users do want to have SD calculation displayed on the chart as per their method of analysis. We have noted this and working to enable a more dynamic approach to SD on PayOff chart. For the time being, it is configured for 1 day SD only.