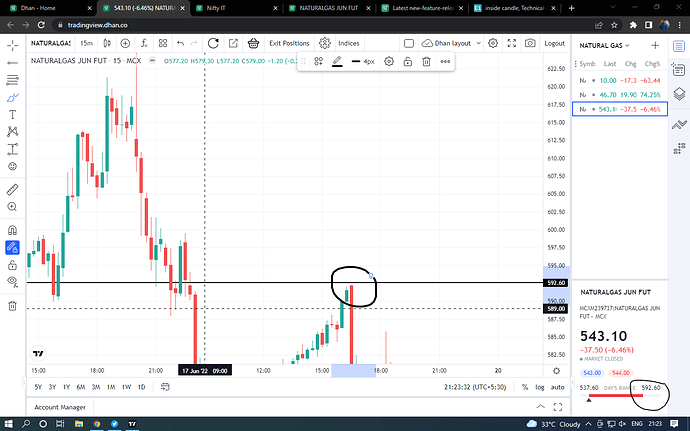
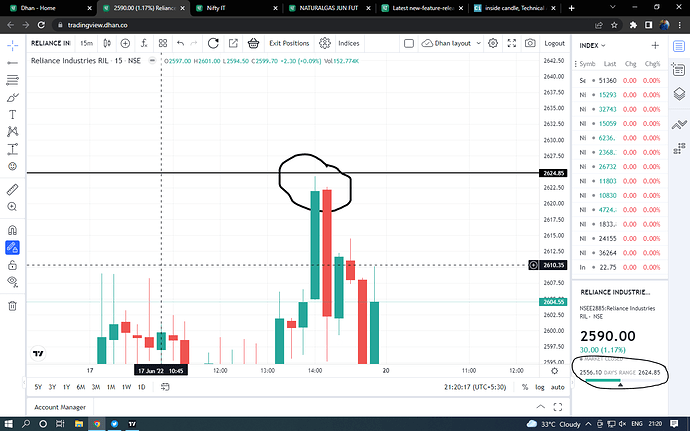
on tradingview chart showing wrong candles price on lower timeframe check attached images in on on 17 june Natural gas high is 592.60 but in lower timeframe topmost candle made high at 592.30 on same day in reliance chart high was 2624.85 but in lower timeframe topmost candle made high of 2624.30 this is happening everyday in every stock it creates confusion please resolve it
Hi @mbhat4590,
Trades at the exchanges happen within microsecond intervals, and the volume increases on volatile days. To shows this on charts, combined snapshots of many such trades, over one to four times every second, is used. Meaning, charts are formed using such combined snapshot and not the thousands of ticks or trades that happen on the exchange. Hence though rare, sometimes, a chart may not show a specific data point, especially if it sustains only for minutest of a second. This is common across industry.
At the same time, we are working to bring as much data processing as possible in-house, to optimize the performance.
Regards,
Dhan Customer Support

