Hi,
You have highlighted a very pertinent issue. I have also tried to bring to notice this to Dhan’s team. But, sadly, didn’t get proper response.
The case in point is AGI Greenpac 13th April intraday charts (i.e. Hourly and below).
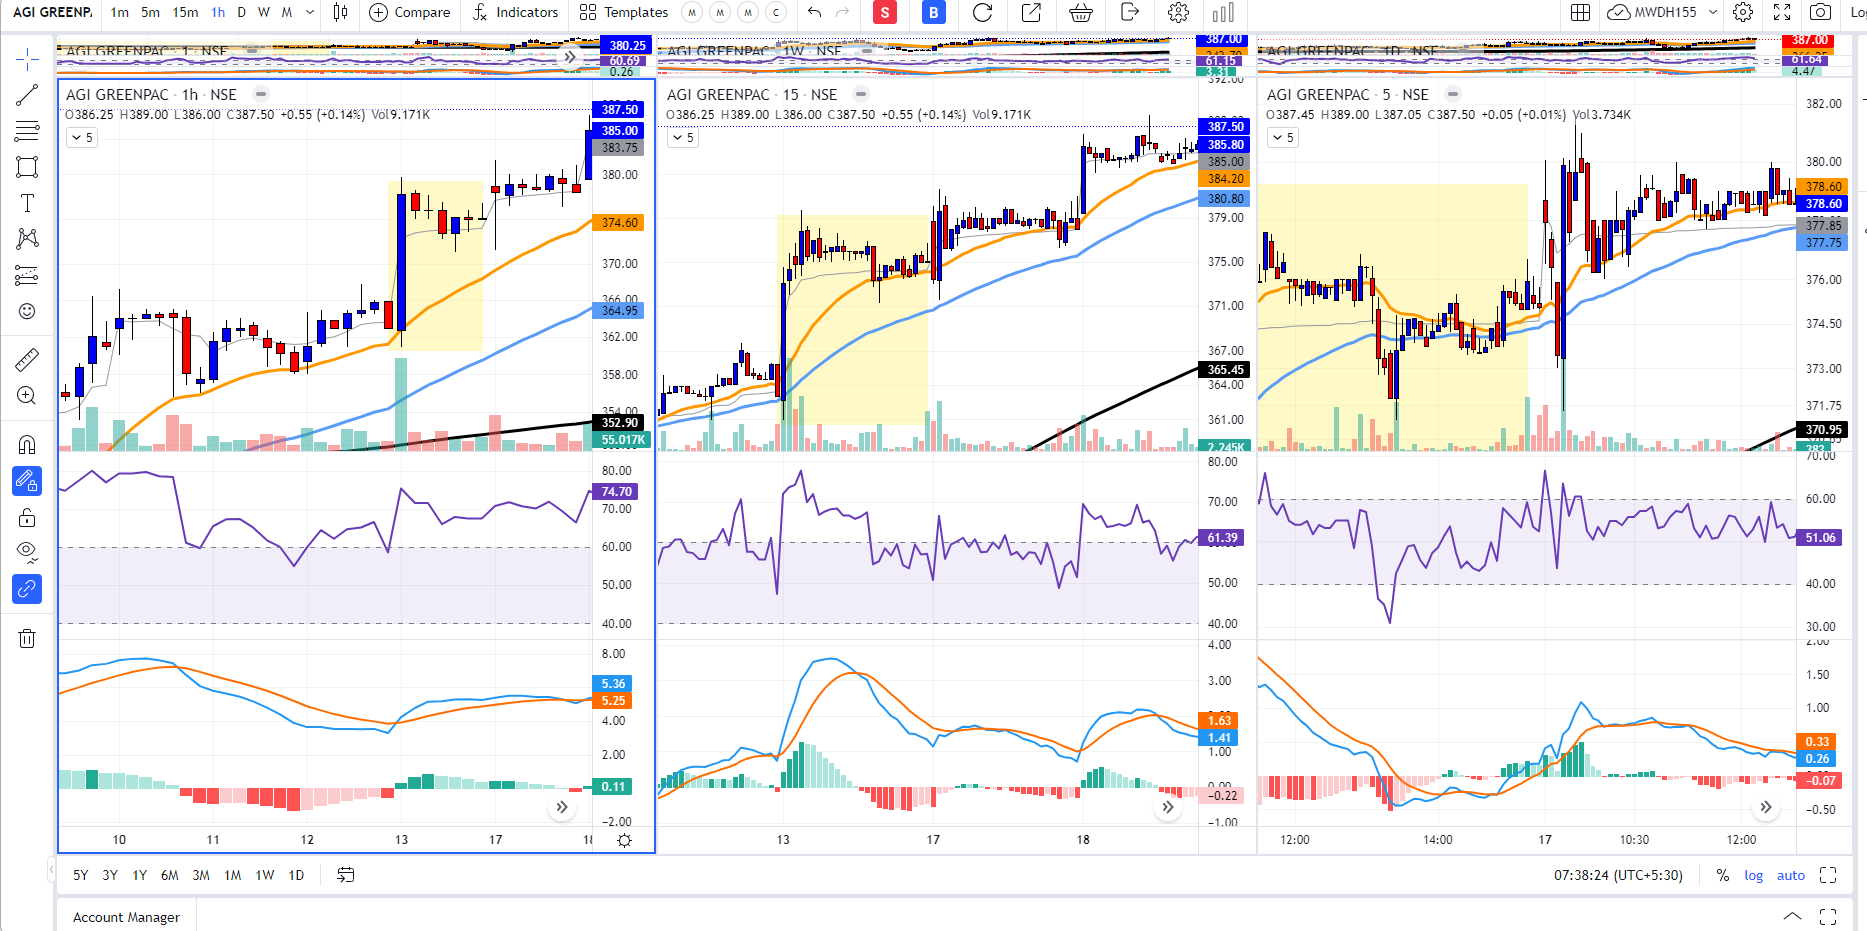
The first candle in the highlighted portion doesn’t match with the candle formation on Daily chart.
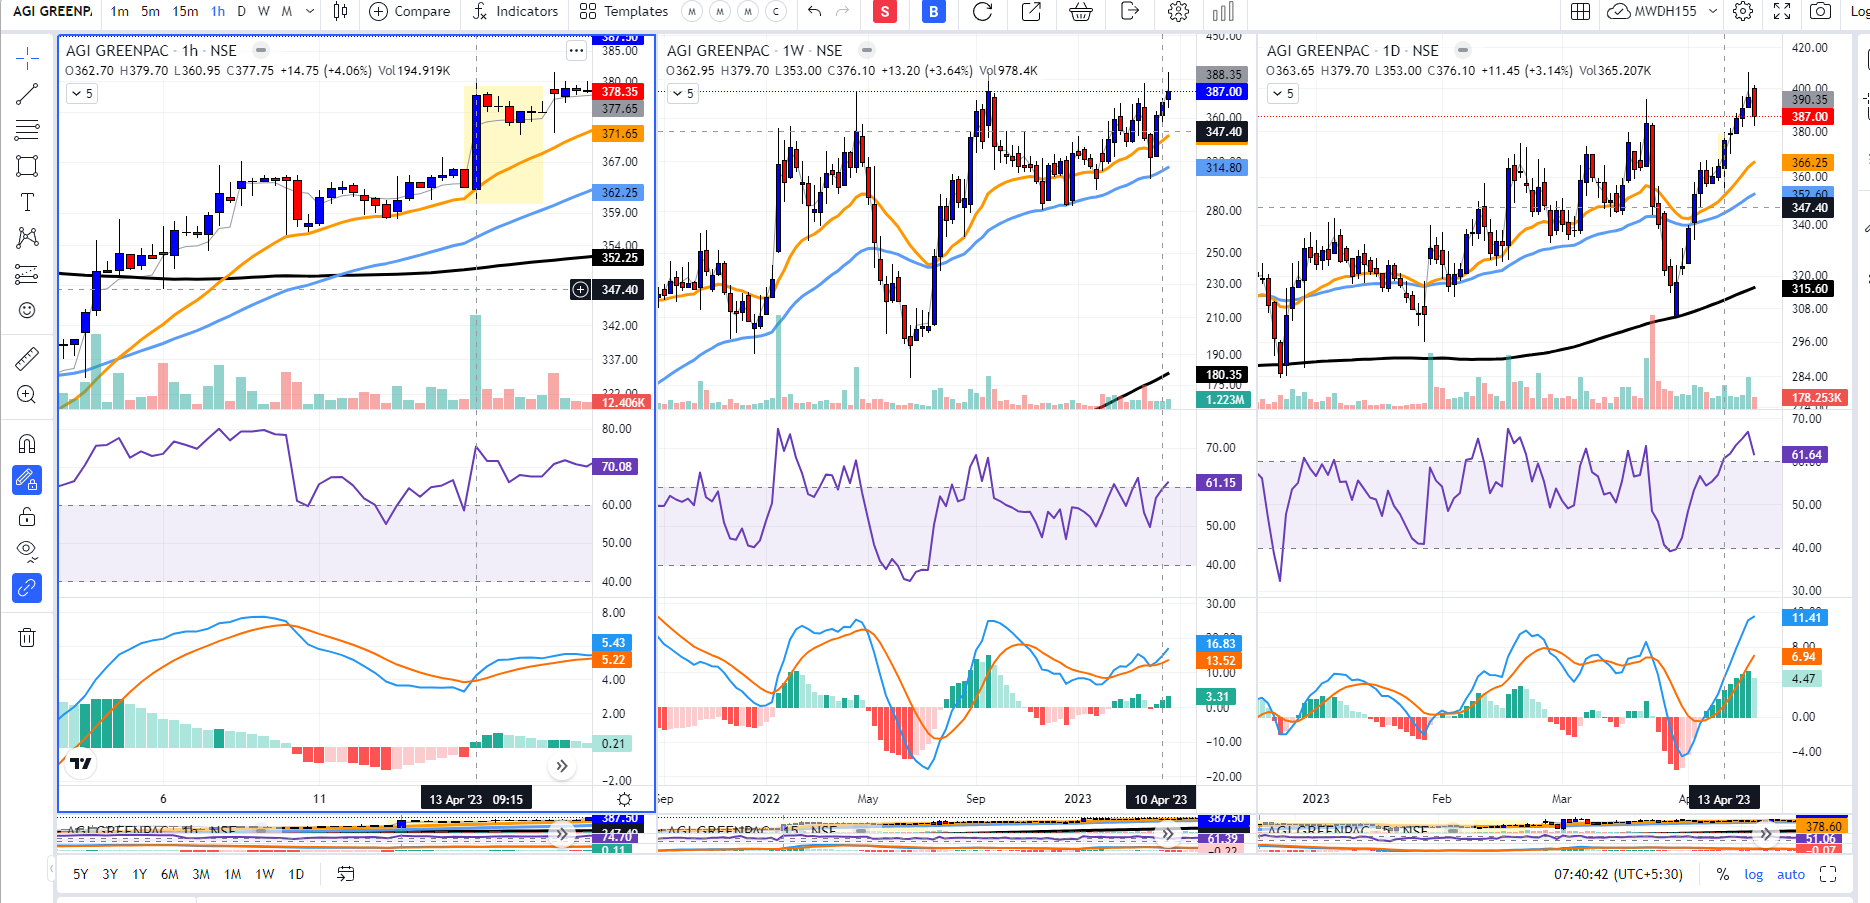
See the low on H chart first candle in the highlighted portion is 360 whereas the daily chart shows the low of 353.
This error I noticed in realtime and tried to bring to their notice but I got a fixated reply that charts are based on exchange feeds and charts are correct based on exchange feed.
Then I went to tradingview.com and some other brokers platforms to check whether it is really exchange feed error. It was not. All other platforms were showing correct candle formation.
Then I approached Dhan’s team again and pointed out again. But the concerned person asked me to approach Exchange instead of referring to tradingview or other brokers. I was surprised.
I didn’t know how could I reach exchange I don’t know. Moreover, how probable it is that “only Dhan got correct data from exchange and rest everybody got it wrong”.
I referred to this post by Pravin ji:
In this post, he mentions:
However, when you look at past candles, there is no margin of data being lost as our chart data servers are present within the same data centre as our streaming servers and the data is continuously saved on server side.
So that means, if my PC had got some erroneous data due to realtime feed, it should appear correct by now. But the issue is still same, it means Dhan’s servers got some wrong data and that’s what I tried to bring to their notice.
Finally I gave up. And the error is still as it is!
This happened on some other occasion also, anyway!