Hello,
If we have to buy options contract what we do is pay the price multiplied by lot size.
If we have to short options contract what we do is pay the price multiplied by lot size multiplied by approximately 3 which may vary broker to broker.
So, if we buy call options contract or short put options contract then in both cases it would be implied that the position holder is either bullish or direction neutral. But I can safely superficially assume in layman’s terms that the position holder is having overall positive sentiment about the scrip.
(This idea goes for buying put contract and/or shorting call options too. Just overall sentiment is negative in such case)
So, if the above statement holds truth, one thing can be done is to calculate the entire options chain of a particular scrip where
A. (Open Interest multiplied by CE LTP for all strike prices- for Call long) + (open interest multiplied by PE LTP multiplied by 3 for all strike prices- for Put short). Then add both values.
B. In this case, calculation would be same as above, but contract would be for long, Put contracts of all strike & for short, call contracts of strike.
Now the final calculation part.
Add both point A & B then calculate percentage of A & B from that.
Can a feature be made out of this strategy?
This information would allow a trader to navigate the market’s anticipation of immediate directional strength with a high degree of certainty.
P.S: this can easily be done for a scrip on Excel but to do it for all scrips is quite painful.
May be you want to say that OTM stikes should be seen from the short perspective where as ATM and ITM should be seen as long perspective for the above calculation.
Yes, but one who shorts generally pays 3 times greater than the one who bought the contract. In this hypothesis, I have concluded that there is no need for distinction between ATM/OTM/ITM.
In my opinion PCR should be used along with the mentioned method.
To make it clearer, I have uploaded my calculation based on to-day’s closing price in Excel on google drive. Please check the below link for the same.
Link: Loading Google Sheets
After some point of time, may be If possible please share your observations from this analysis with some data points. It would be interesting to learn about.
Hi @aritra not always the seller of the option pays 3 times the price of a buyer. Understand this as if I am selling at Rs. 150 (3 x Rs. 50) then there has to be a buyer buying at Rs. 150 then only the trade will happen. However, it is the margin which seller has to keep with the CC/Exchange which brings up that fact that seller takes more risk then the buyer.
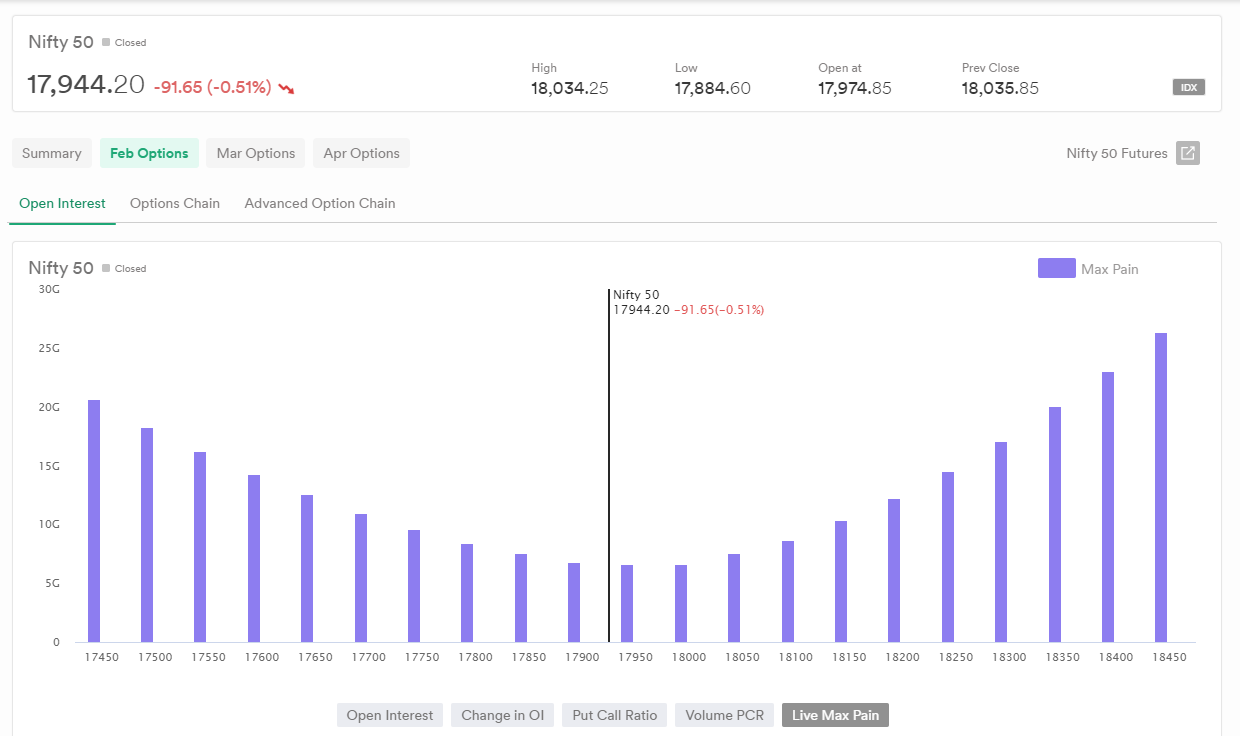
Now, what you are trying to do with the option chain is essentially finding out the “max-pain”. If any contract expires at the max-level level, the option writer (seller who takes high risk) incurs a minimum loss. Please find the attached screen shot for NIFTYFEB23FUT. The max-pain level is around 17950 which indicates that at this strike if NIFTY expires, the option writers will lose the minimum. Note that this changes on real-time bases and thus we have provided Real Time Max Pain.
When one looks for PCR more than 1 & gets multiple scrips in return, this analysis comes in handy. It helps to select on which scrip more money is involved since the method directly deals the amount of money that is put in options market.
Even if anyone wants to use it as a standalone method, can be used efficiently.