Introducing: Multi Strategy Chart for Options Trading (on Options Trader on Web)

Hi All

After the successful launch of Options Trader with the Custom Strategy Builder earlier this year, we are glad to see the response for the platform from our users and also the trading community. Your feedback and support have been instrumental in driving our continuous efforts to enhance your trading experience across all our platforms.

And now, we are excited to announce the latest addition to Options Trader by Dhan - the Multi Strategy Charts for Options Trading.

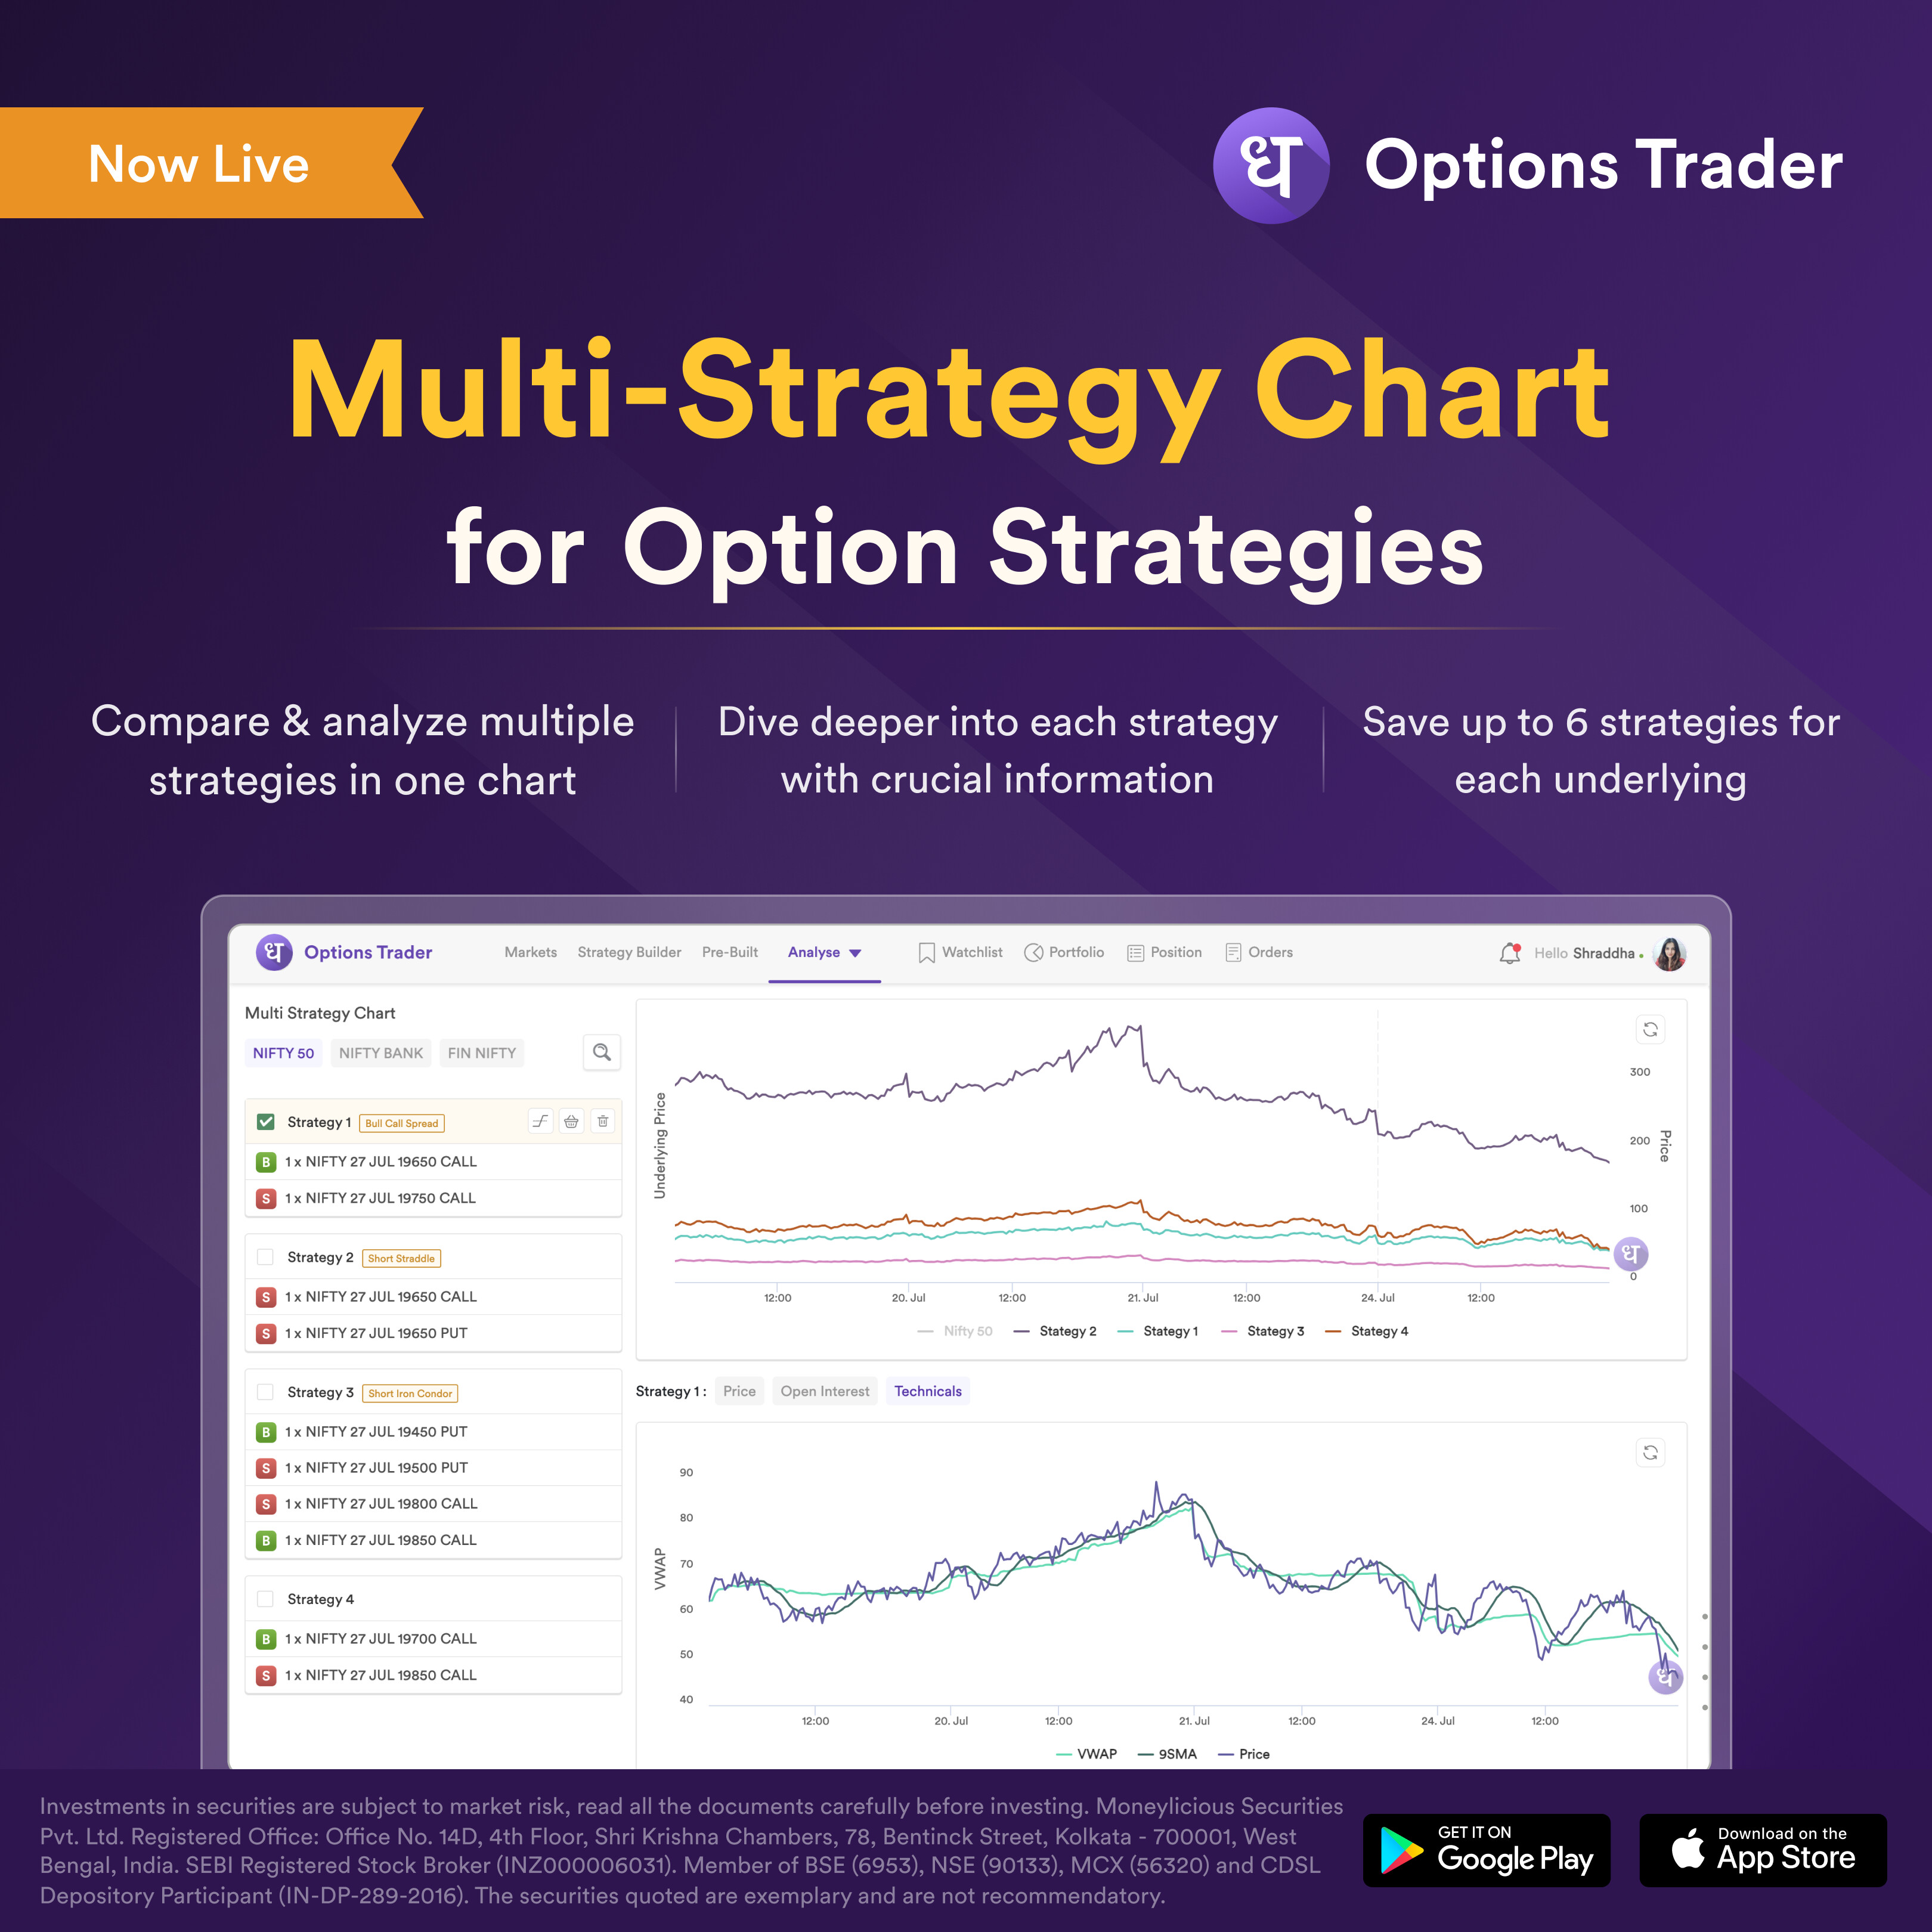
Going ahead, now you do not need to hop between multiple screens and struggle to compare various strategies. With our new Multi Strategy Chart, you can now visually view and analyse different strategies in a single comprehensive line chart, making it easier to spot trends, overlaps, and opportunities.

You can load any of the popular strategies from the “Fast Create” button below the chart, or click on “Add Strategy” to create your own custom strategy. These strategies will be saved for future reference, making it convenient to switch between different trading approaches. At any given time, you can view strategies for one underlying only. However, you have the freedom to switch to different underlying as needed. You can save up to 6 strategies for each underlying spot, allowing you to experiment with different approaches without losing previous setups.

For deeper insights into each strategy, simply select a strategy from the side menu. You’ll be able to observe the price and open interest movements of individual legs, providing you with a better understanding of their correlation with the overall strategy. This feature allows you to gauge market sentiment based on the movements and identify potential shifts in the options market.

On top of that, we have integrated essential technical indicators like VWAP (Volume-Weighted Average Price) and SMA (Simple Moving Average), empowering you to fine-tune your trades and optimise your strategies.

We believe it will truly enhance your options trading experience on Dhan. Whether you’re a day trader, a swing trader, or a seasoned pro, the Multi Strategy Chart is designed to empower you to make better, data-driven decisions.

So, explore the Multi Strategy Chart on Dhan. We can’t wait to hear your feedback and see how this feature elevates your trading.

As always, thank you for being a part of the Dhan community. Your feedback, suggestions, and support have been invaluable to us as we continue to improve and innovate.

Happy Trading,
Naman Sharma

7 Likes

Add strategy feature not working. Unable to save customised strategy

1 Like

Excellent, Eagerly waiting for Commodity Analyser addition.

1 Like

I see there is already an option of displaying strategy charts in candlestick mode on options-trader.dhan.co. This means you are already calculating OHLC values of combine premium in a strategy.

Im wondering then can this strategy chart be made available on tv.dhan.co? Since tv.dhan.co is your main charting platform, displaying strategy charts there can make it possible to use indicators as well as change the timeframe, use drawing tools etc…basically all the features of a charting platform.

There can be many uses for seeing a chart of a multi leg strategy. A use case on top of my mind is that of creating a synthetic futures by ATM buy CE and sell PE which emulates futures but with low transaction costs. But this 2 leg strategy doesnt exactly follow futures chart so it is useful to see the chart of combined premium.
Im sure there will be other strategies users create for which it will be a game changing experience if they can see their candlestick charts on tv.dhan.co

Hi @dhingrab

Thanks for sharing your feedback & feature request. Yes, we do calculate OHLC of the combined premium, but it is reverse calculated from the tradable instrument in the market. The final outcome (the options strategy) is not a direct market where we get its LTP, LTT, LTQ, OHLC, Best Ask & Bid etc. All these information is derived & we do not save it.

We take your feedback as request for technical indicators on the strategy premium charts and we do have two indicators already on the Multi Strategy Charts, we will try to bring more indicators.

1 Like

Thanks for taking note of this. I understand your point that a strategy is not a tradable instrument and hence its OHLC values are not in the data feed that you get.

One way to plot a strategy chart / combined premium chart on tv.dhan.co is to implement maths operators in search bar.
This means when the user inputs in search bar 18Jan22000CE + 18 Jan2200PE, the backend logic ‘adds’ individual OHLC values in real time to plot a single chart.
Similarly, if a user does + 18Jan2200CE - 18Jan2200PE, then backend logic ‘subtracts’ individual OHLC values in real time and plots the combined chart accordingly.
This way you still dont have to save OHLC values. This requires implementing the logic of 4 maths operators - + - X / only once and then it takes care of chart plotting in real time no matter how many legs a strategy includes.
But again i wouldnt be sure of the technical complexity of this as no other broker has implemented this even for simple scrips let alone options.
Although TV already has maths operators since long.

Anyway just to put it on record my requirements regarding strategy charts -

  1. indicators like vWAP, MA, ST etc
  2. changeable timeframe, from 1min to 1hr
  3. historical data till as long individual legs chart exist
  4. simple scroll zoom like in regular charts rather than select a section to zoom

Can you pls enable dark mode.

I can not see this bright white screen and tiny grey fonts scribblings.

@Naman