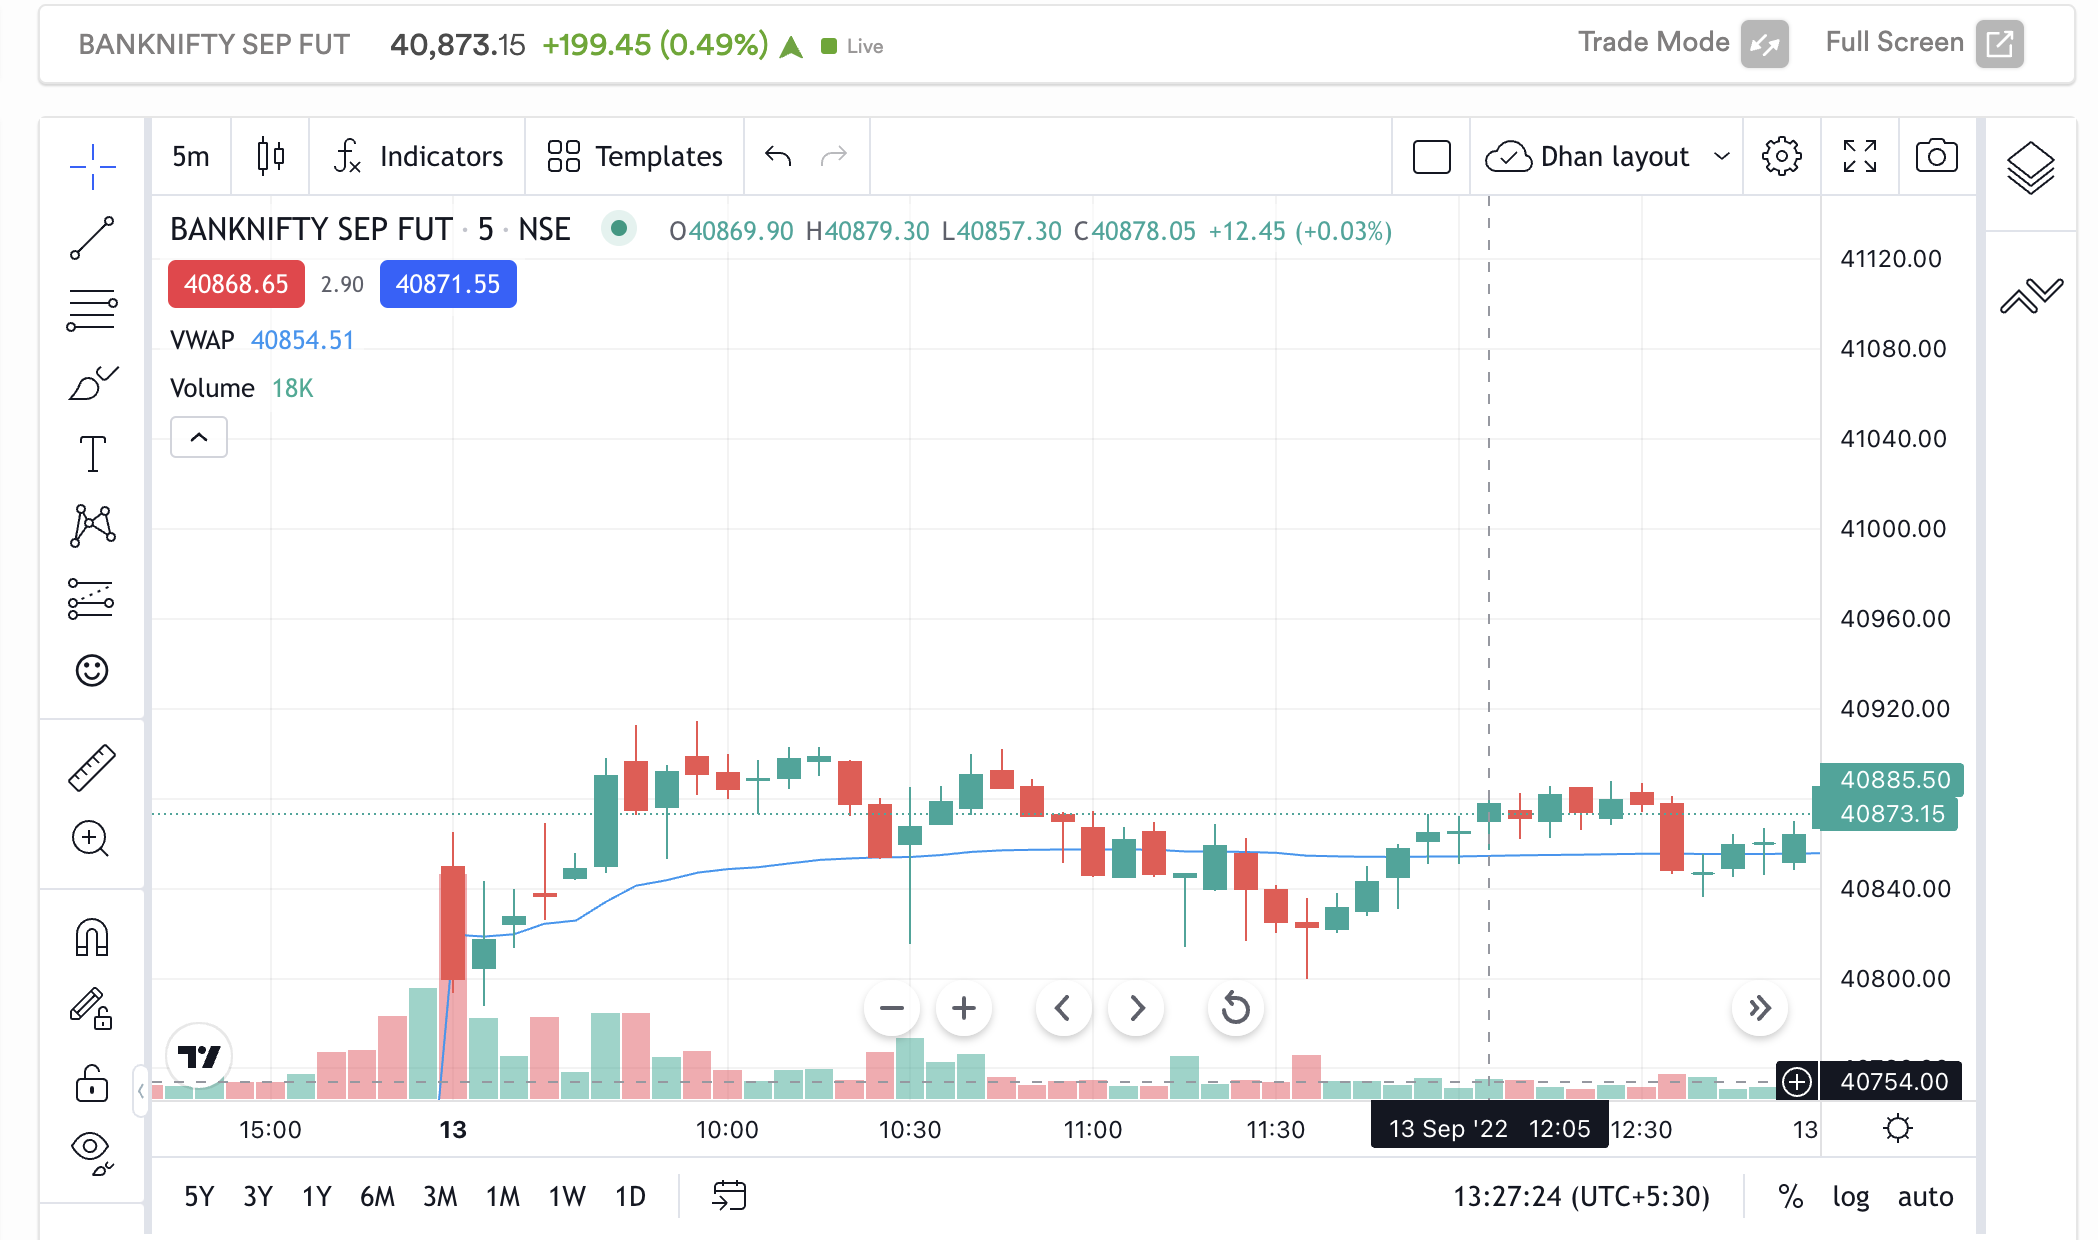
Its correct on other brokers chart but not correct on Dhan chart, just checked Fyers chart, its correctly updated there.
Please focus on Priority features then go to Fancy features.
Whats the use of 2 Platforms whwn your Charting is Not exactly updated?
Other brokers Single platform is way better than yours 2 bcz They focus FIRST ON MAIN ISSUES like Charting updation.
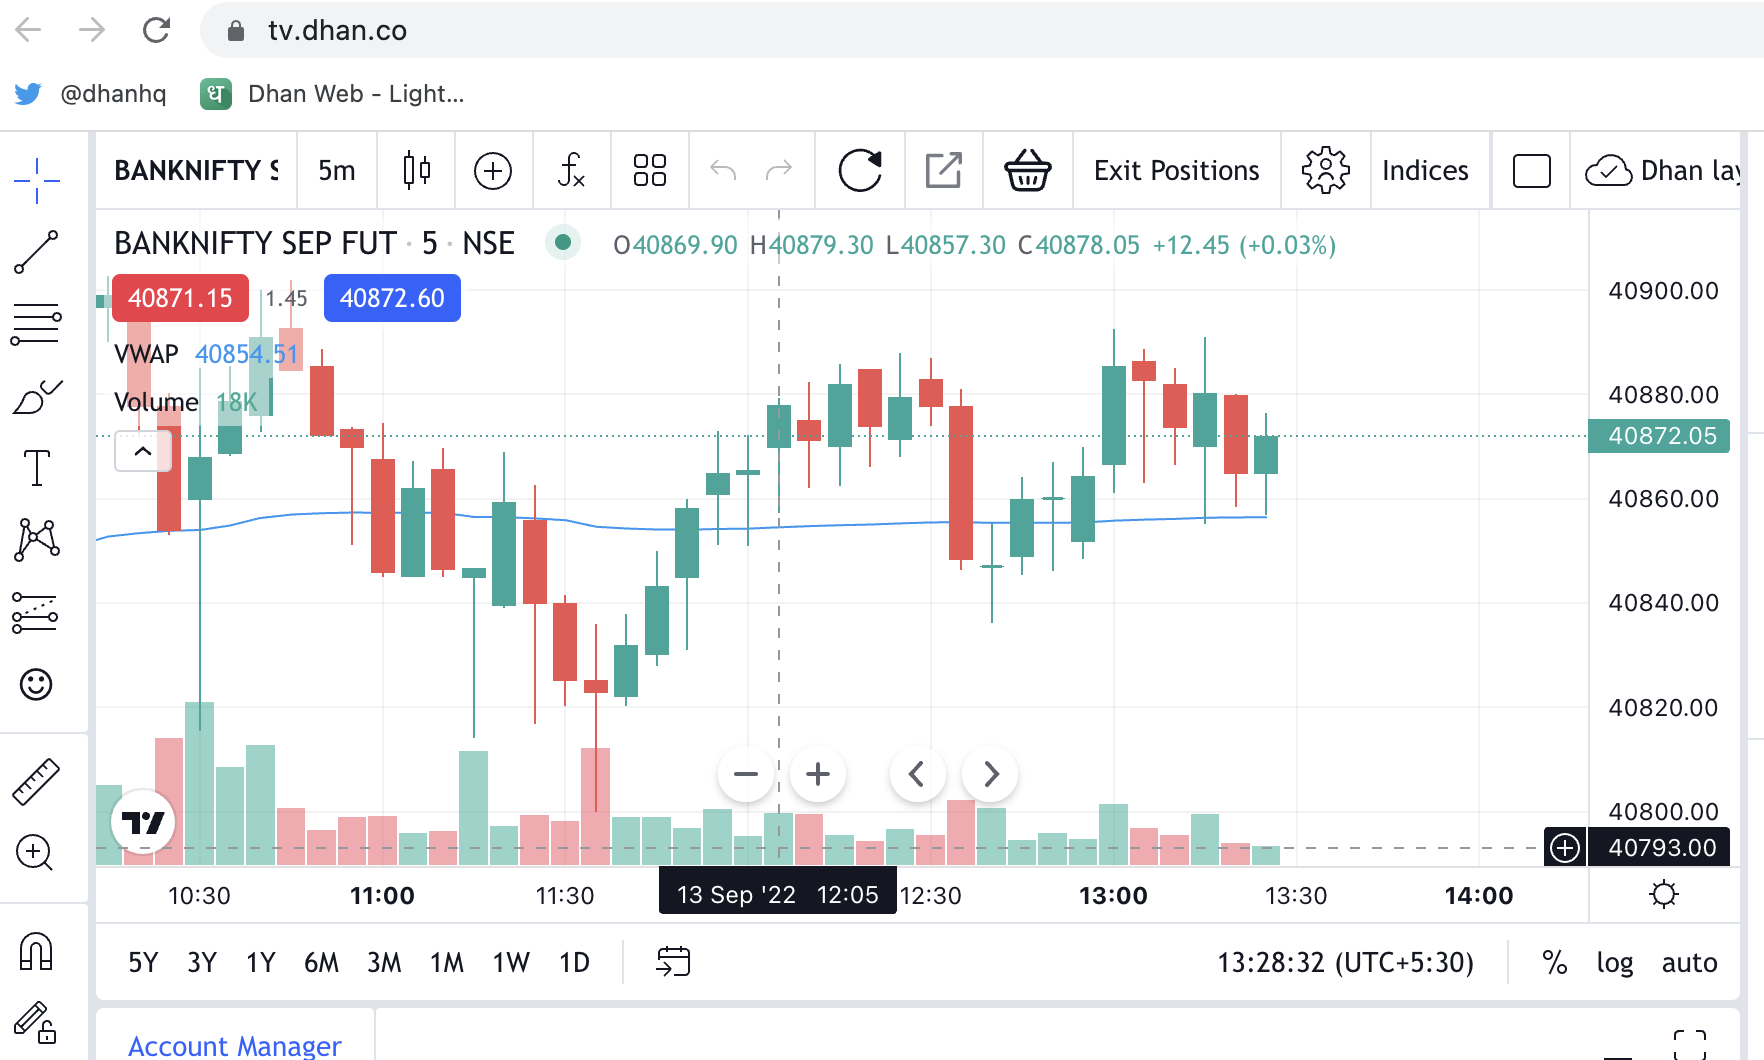
I usually wouldn’t do this, but saying 1-2 sec slower is a matter of concern. Here is something I recorded just now on my machine - its is Dhan chart performance v/s other broker v/s tradingview v/s another large brokers.
It’s clearly visible that Dhan is much faster than all of them and we keep updating our systems to make it even faster, better and reliable.
That aside: Additionally note that no two charts across brokers or platforms will be same. Please note that charting is very complex and has multiple components that depend on - your ISP, network, connectivity, our connection with exchange, exchange pop location, server location, data rendering by our end, your machine, cpu & memory utilization and much much more.
If there are problems, on Dhan we acknowledge them and also solve for it always. We still have the harshest of feedbacks we get from our users on this community and very rarely delete any posts or comments, even if they are against us.
Specially for charts, we monitor them endlessly through the market trading hours ourselves. If any thing goes wrong here, we know of this much before our users will and if it goes wrong - we will be faster to resolve.
I have seen lot of charting issue comments being posted here. So let me give few angles.
At exchange orders get executed in nano second interval. Each order that gets executed gives a price tick. But brokers don’t get tick by tick data feed. Exchange sends out 1 second snapshot to brokers. This 1 second OHLC may not contain all ticks.
If you have kept the chart open for a while the plotting happens from the data you recieved. Any internet issues means you may have got less data and hence incorrect candle formation. If you reload a chart then the historical data comes from broker / data vendor server again and this will have complete data and correct candle formation. But you will see the chart changing.
These are technical issues in a tech first world that the broker cannot do much about. The EOD OHLC is the most reliable data feed out there. Intraday you can be in for some surprises - SL hit but not shown on chart, OHLC differences, candle color and shape difference etc.
but plz can you confirm 12 Sep 22; CRUDE FUT SEP 5min. candle (9.00AM) here Vol. on Dhan is 602k BUT, on tradingview its 215k, why is there so much difference, its creating confusion in my Interpretation of Charts.
There is a lot much difference in CPR location on same day of both platforms, may lead to have wrong analysis.
@abhayverma071 I checked with some other platforms where they take data from exchanges, and Dhan data seems to be more or less correct. Dhan shows 602 vs 598. (Note: its not 602K). I am assuming you mean 215, not 215K. Minor differences in candles can be possible for many reasons, while 215 is way off.
Yes in crude its 215 & 602 but thats not minor difference sir + CPR location is different, thats why i was confused in analysing. Which chart to follow
Therefore, i can’t rely on Dhan charts anymore + Not getting any reply on mail too so better to correct this error otherwise there is no use of having other fancy features, if dhan cannot even have proper chart data.
Volume + Cpr i checked and both are incorrect as mentioned above.
Especially CPR and i think there might be many such indicators which shows their incorrect value.
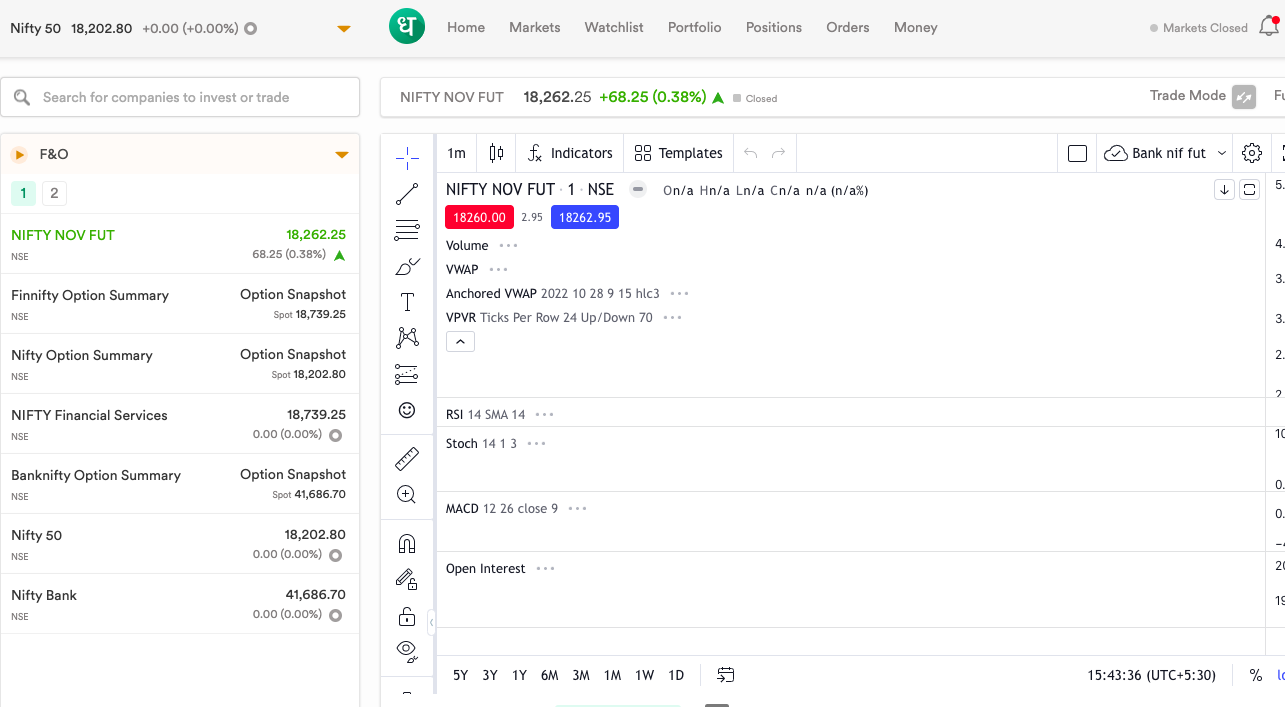
i was trying to use Nifty Futures chart late night for analysis. I have observed on one more broker site also, data late night after 12 doesn’t show proper. Is it because of technical updates ?
At Dhan we run multiple processes on systems and data post market closing hours (ie after MCX closes), I am sure other brokers do as well, at least ones who are tech focussed should.